Seasonal patterns in shares – should we “sell in May and go away” and what about renewed trade war fears?
Key points
- Seasonal patterns typically see shares do well from around November to May and not so well from May to November. This partly reflects a combination of tax loss selling in the US, new year cheer and the pattern of capital raising through the year.
- While we see shares doing well this year, right now they are vulnerable to a short-term pull back after strong gains since December. Renewed trade fears obviously don’t help.
Introduction
Since late last year share markets have rebounded with US shares up 25% to their recent high, global shares up 22% and Australian shares up 17% as last year’s worries about tightening monetary policy led by the Fed, global growth and trade wars have faded to varying degrees. Following such a strong rebound some have said that maybe it’s now time to “sell in May and go away” given the old share market saying. Of course, this is a reference to seasonal pattern in shares.
It’s all seasonal
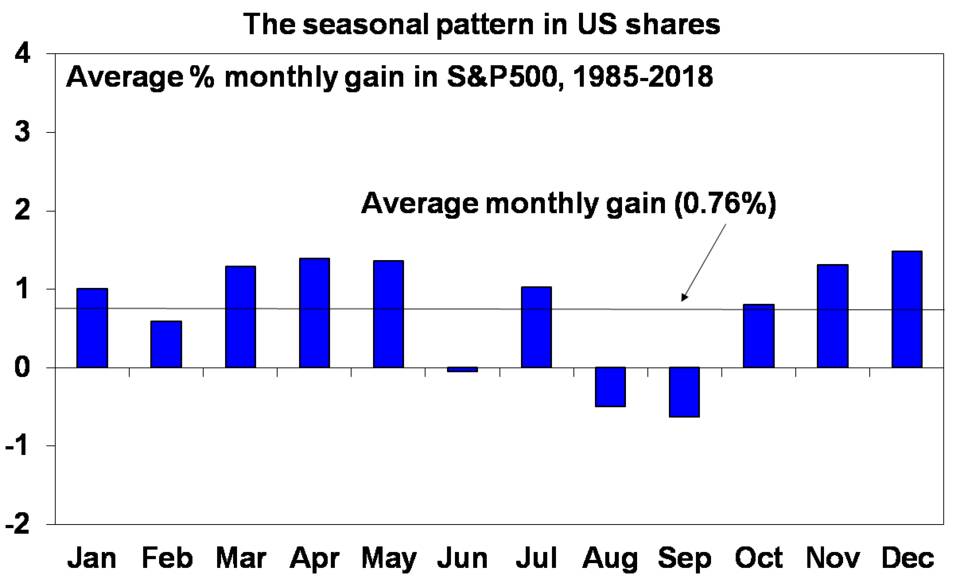
Seasonal patterns have long been observed in equity markets. Yet, despite the potential they provide for astute investors to profit from them – and in so doing arbitrage them away – they seem to persist. The “January effect” has perhaps been the most famous, where January typically provides the best gains for US stocks, but anticipation of it in recent years has seen it morph into December such that it has become the strongest month of the year for US shares. However, it is part of a broader seasonal pattern, which is positive for shares from around October/November to around May and then weaker from May. This can be seen in the seasonal pattern of average monthly changes in US share prices (using the S&P 500 index) shown in the next chart.

The key factor behind the seasonal pattern is the regular ebb and flow of investor demand for shares relative to their supply through the course of the year. In the case of US shares the principal drivers of the seasonal pattern are:
- investors and mutual funds selling losing stocks to realise tax losses (to offset against capital gains) towards the end of the US tax year in September. This is also normally at a time when capital raisings are solid;
- investors buying back in November and December at a time when capital raisings wind down into year-end;
- which then combines with the tendency for investors to invest bonuses early in the new year, new year optimism as investors refocus on the future, put any disappointments of the past year behind them and down play bad news all at a time when capital raisings are relatively low. The illiquid nature of investment markets around late December and January (due to holidays) makes these effects all the more marked.
The net effect has been that the US share market is relatively weak around the September quarter, strengthens into the new year with January often being the strongest month and then remains solid out to around May by which point new year optimism starts to fade a bit. As noted earlier, in recent years anticipation of the “January effect” has caused buying to pull it forward into December. Calendar year end window dressing by fund managers may have also added to this tendency. Since 1985 US share prices for December have had an average monthly gain of 1.5% monthly gain. This compares to an average monthly gain across all months of 0.76%. By contrast August and September are the weakest months with falls on average.
Consistent with the influence of the US share market on global markets generally, along with specific local influences, this seasonal pattern is also discernible in other countries, including Europe, Asia and Australia. In Australia the January or now December effect is not as dominant as in the US, possibly because tax effects are not relevant in Australia around that time of year. The seasonal pattern for the Australian stock market is shown in the next chart. While the strongest months of the year in the Australian market are April and July, December also tends to provide above average gains. Since 1985, Australian share price gains in December have averaged 2.1%, with April averaging 2.3% and July 2.2%. This compares to an average monthly gain for all months of 0.61%. (Note that the lower average monthly gain for all months in Australia compared to the US partly reflects the fact that a greater proportion of the return from Australian shares comes from a higher dividend yield compared to the US.)

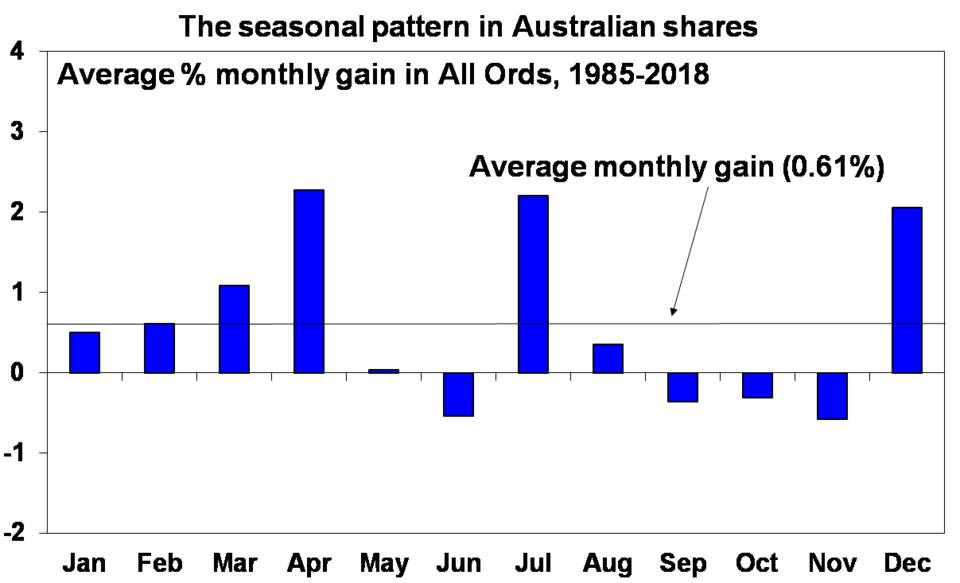
In Australia, tax loss selling may explain the weakness often observed in May and June and the strength often seen in July, given that the Australian tax year ends in June.
“Sell in May & go away, buy again on St Leger’s Day”
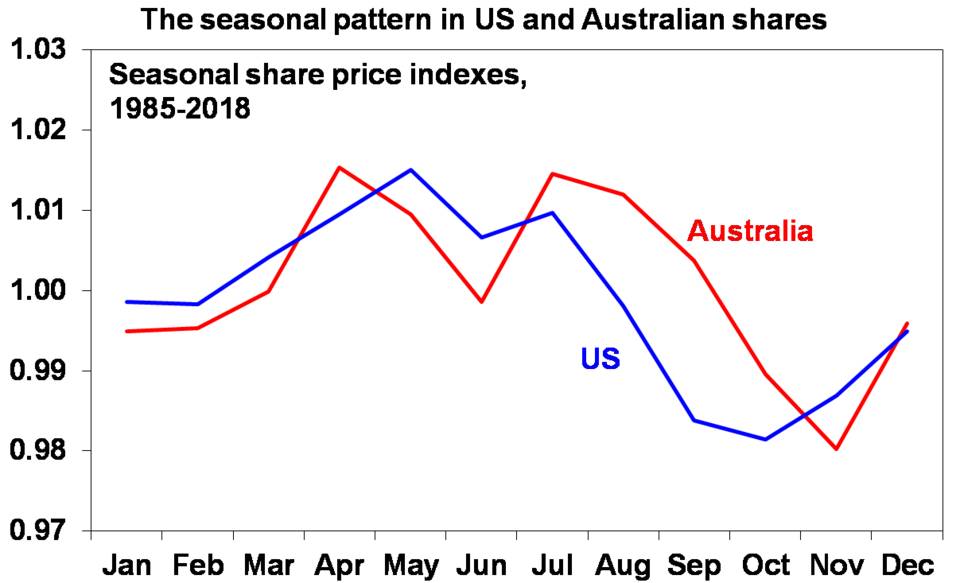
As a result of this monthly behaviour a typical pattern through the year is for stocks to strengthen from around October/November until around May (or July in Australia’s case) of the next year and then weaken into September/October (and November for Australian shares). This seasonal pattern can clearly be seen in the following chart which shows an index for US and Australian shares and the month to month pattern of share prices after the longer term fundamentally driven trend is removed.

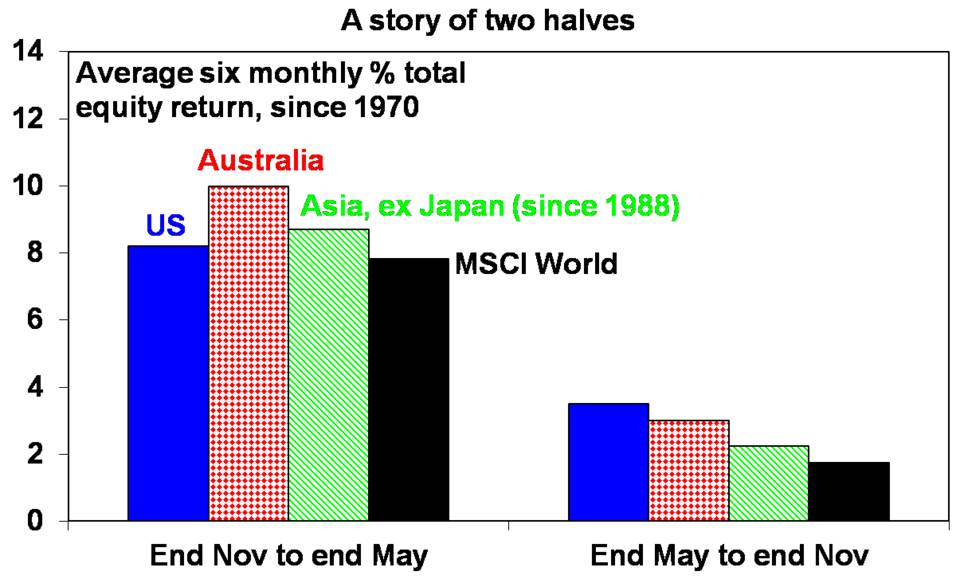
Breaking the year into two six-month periods also reflects this pattern. Since 1970, the average total return (ie, from price gains and dividends) from US shares from end November to end May is more than double that from end May to end November. A similar pattern exists in Australia, Asia and for global shares as shown in the next chart.

While the US influence may be playing a big role in the continuation of this seasonal pattern in shares, the old saying in its full form of “sell in May and go away, buy again on St Leger’s Day” has its origins in the UK as St Leger’s Day is a UK horse race on the second Saturday in September suggesting that the seasonal pattern in shares dates back to the UK. In fact it may have its origins in crop cycles with grain merchants having to sell their shares at the end of the northern summer to buy the summer crop (which depresses shares around August/September) and they then bought back in after they sold the crop on to mills. Of course, that’s not so relevant to today. So, the explanation discussed earlier explains why it likely persists.
Qualifications
There is no guarantee that seasonal patterns will always prevail. They can be overwhelmed when contrary fundamental influences are strong, so they don’t apply in all years. For example, while Decembers are on average strong months in the US and Australia that wasn’t the case last December and not all years see weakness in the May to October/November period. However, they nevertheless provide a reasonable guide to the monthly rhythm of markets that investors should ideally be aware of. In simplistic terms, around May (and July in Australia) is perhaps not the best time to be piling into shares and around September to November is not the best time to be selling them.
What about now?
For the year as a whole we see shares doing okay. Valuations are okay helped in part by very low bond yields, global growth is expected to improve into the second half of the year and monetary and fiscal policy has become more supportive of markets all of which should support decent gains for share markets through 2019 as a whole.
However, from their December lows, shares – globally and in Australia – have run hard and fast and so are vulnerable to a short-term correction. Still soft global growth indicators and the latest flare up regarding US and China trade could provide triggers.
President Trump’s latest threat to increase the tariff on $US200bn of imports from China from 10% to 25% (delayed from January) and his threat to look at taxing remaining imports from China too suggest that the latest round of US/China trade talks in China did not go as well as planned and looks aimed at putting pressure on China to resolve the talks. Ultimately, we remain of the view that there will be a resolution given the economic damage not doing so would cause, particularly ahead of Trump’s re-election bid next year (US presidents don’t get re-elected when unemployment is rising). But the latest threat adds to the risk of market weakness in the short term, particularly if China delays a trip to the US to continue the negotiations in response to Trump’s threat.
In Australia, uncertainty around the impact of various tax increases if there is a change of Government in the upcoming Federal election could cause short-term nervousness for the Australian share market.
Of course, long term investors should look through all this.


Leave a Reply
Want to join the discussion?Feel free to contribute!