Total Wealth Management
CALL NOW (07) 3281 1226
  • Our Team
  • Services
    • Retirement Planning
    • Centrelink Maximisation Strategies
    • Retirement & Superannuation Planning
    • Personal Insurance Advisers
    • Tax Planning & Strategies
    • Debt Recycling
    • Lifestyle Expense Planning
    • Wills & Estate Planning
  • Process
  • Contact
  • Facebook
Phone: (07) 3281 1226
Total Wealth Management
  • Home
  • About
    • Meet the Team
    • Testimonial
    • Our Advice Process
    • Fees & Charges
  • Services
    • Investing
      • Wealth Accumulation & Management
    • Insurance
      • Personal Insurance Advice
    • Tax Planning & Strategies
    • Loan & Debt Reduction
    • Retirement
      • Retirement Planning
      • Superannuation Advice
      • Centrelink Financial Advice
      • Wills & Estate Planning
      • Lifestyle Expense Planning
  • Knowledge Centre
    • Blog
    • Life Stages
      • Young Independents
      • Retirement Planning
      • Young Families
      • Mature Families
      • Pre-Retirees
      • Retirees
      • Twilight Years
    • FAQ
    • General Finance Calculators
    • Useful Links
    • Free Reports
  • Contact Us
  • Search
Total Wealth Management > Archived

Newsletter – 12th Apr 2019

April 12, 2019/0 Comments/in Archived, News /by Digilari

Dear Sir/Madam,

This year is passing us by too quickly and Easter is upon us again!

Last Friday, the TWM staff had their annual flu shots, as there are no sick days allowed in this office!! Rod would like to recommend to any of clients to go see Phuong from Priceline Pharmacy at Riverlink for your flu shot as we did not feel a thing!

By now, our Centrelink clients should have received a letter notifying them that their Age Pension has increased from the 20th March 2019 and the Government also paid a one-off Energy Assistance payment as at 2nd April 2019. Other beneficial changes to the Age Pension recipients include an increase in the Work Bonus for those that are still working and an expansion of the Pension Loan Scheme.

There was a little mistake in our last newsletter – the date for our annual Golf Day! It is coming up next month on Friday 24th May 2019. We have been sending out invitations so if you have not received one and you would be interested in playing or entering a team, please call the office.

Until next month,

Emma

“Millennial socialism” and the swing of the political pendulum back to the left – what it means for investors

March 25, 2019/0 Comments/in Archived /by Digilari

Key points

  • Growing support for higher taxes on the rich and greater government intervention in the economy suggest median voters have shifted to the left. Support for economic rationalist policies has fallen.
  • The risk is that the shift away from economic rationalist policies to greater intervention will contribute to constrained medium-term investment returns.

Introduction

When I was in my early 20s I thought socialism might be the way to go. Two things happened. One I studied economics which led me to the conclusion that socialism/heavy state intervention doesn’t lead to the best outcome in terms of living standards for most. Second, I had the benefit of a trip to the USSR before it and the eastern bloc disintegrated. It must have been Paul McCartney’s faux Beach Boys’, “Back in the USSR” that got me interested! Sure the history and scenery were fantastic and I like the fact that I saw it before the wall came down – but economically it was a mess. And trying to spend excess roubles before we left the USSR was a struggle (nothing but off chocolate to spend them on). “Socialism” seemed to work a bit better in the Deutsche Democratic Republic – but not really and it was a relief to come through Checkpoint Charlie knowing decent food (McDonald’s) was waiting.

So I ended up gravitating to the centre with the view that the best approach is to allow a market economy with the government providing a good safety net, education and intervening where there are market failures. But a wise man told me when I was young that it’s best to start off on the left when you are young otherwise you will end being like Attila the Hun, as you move to the right as you age. Given the tendency for the young to start off on the left its no surprise to see younger generations favour a bigger role for government in what The Economist magazine has dubbed “millennial socialism”. 

US Millennial & Generation Z see a bigger role for government
Source: Pew Research Center

If the millennials and Gen Z follow the normal pattern they will shift to the right as they age like their forebears. So nothing new! Well maybe but there is a big difference now compared to the 1980s. Back in the 1980s the political pendulum (or technically the median voter) was moving to the right. So my ageing was in tune with a big picture political cycle. Now the pendulum is swinging left. We first looked at this three years ago (see “The political pendulum swings to the left”, Oliver’s Insights, June 2016). Since then it’s become more evident. This note looks at what’s driving it and what it means for investors.

Political cycles beyond elections

Just as the weather, economies and financial markets go in cycles so it is with politics, even beyond standard electoral cycles. This has been clearly evident over the last century:

1930s-1970s – the Great Depression gave rise to a fear of deflation and high unemployment and a scepticism of free markets. The political pendulum swung to the left and culminated in the economic disaster of the high tax, protectionism, growing state intervention and the welfare state of the late 1960s and 1970s that gave rise to stagflation.

1980s-2000s – stagflation and the failure of heavy government intervention gave rise to popular support for the economic rationalist/right of centre policies of the 1980s. Thatcher, Reagan and Hawke and Keating ushered in a period of deregulation, freer trade, privatisation, lower marginal tax rates, tougher restrictions on access to welfare, measures to reign in budget deficits and other supply side economic reforms designed to boost productivity. The middle class didn’t support higher taxes on the rich because they aspired to be rich. This was all helped along by the collapse of communism and the integration of the old USSR and China into global trade. The political pendulum swung to the right and there was talk of “The End of History” with general agreement that free market democracies were the way to go.

2010 – ? – but post the global financial crisis (GFC) it seems the pendulum is swinging to the left again and support for economic rationalist policies seems to be fading if not reversing.

What’s pushing the political pendulum to the left?

This reflects a range of factors, in particular:

  • the feeling that the GFC indicated financial de-regulation had gone too far;
  • constrained and fragile economic growth in recent years;
  • stagnant real wages and incomes for median households;
  • high household debt levels preventing individuals from taking on more debt as a way to boost living standards;
  • rising levels of inequality and perceptions that “it’s unfair”;
  • the perceived failure of the baby boomer generation of political leaders to do much about climate change;
  • examples of big business doing the wrong thing;
  • a backlash against immigration in some countries; and
  • a backlash against globalisation.

Of course, it’s being aided by a dimming of memories of stagflation of the 1970s and its causes and the failures of socialism as highlighted by the USSR (although Venezuela provides a current example). So government related solutions or socialism seem more attractive. Allied to this are economic theories like Modern Monetary Theory (or rather, Magic Mushroom Theory) that contends governments can borrow and spend freely in the current environment of spare capacity globally spurred along by the crazy argument that quantitative easing did not cause hyper inflation and higher interest rates so why should bigger budget deficits.

Of these rising inequality and perceptions of stagnant living standards are the big ones. The next chart shows the Gini coefficient, which is about the best measure of income inequality, calculated on incomes after taxes and transfers. It ranges from zero or perfect equality to one indicating perfect inequality with one household/individual, receiving all income.

Rising inequality - Gini coefficients
Source: OECD, Standardised World Income Inequality Database, AMP Capital

The key point is that there has been a general trend higher in inequality during the past 30 years. This is particularly evident in the emerging world but also the US, UK and Australia. Rising levels of income inequality also appears to have come with increase in wealth inequality. Rising inequality may have been more bearable or “masked” in the 1990s and 2000s as nominal income was rising faster and households took on debt to boost their living standards. But in recent times this has become harder and so rising inequality is leading to a backlash.

The political response

In this environment (often populist) politicians have been able to easily tap into voter anger and argue the case for greater public sector involvement in the economy.

  • This was evident in support for self-declared socialist Bernie Sanders and Donald Trump in the US in 2016 (although Trump’s focus on deregulation and tax cuts look like a temporary deviation right). It’s now even more evident in the Democrats with the Green New Deal (that plans to rid the US of carbon emissions – and planes & cows – in a decade) and 2020 Democrat presidential aspirants adopting variations of Bernie Sanders’ policies, with proposals for wealth taxes and a 70% tax rate for income above $10 million (which is supported by 59% of Americans). It’s also evident in less US public concern about rising public debt.
  • It’s been evident in the Brexit vote in the UK which represented a backlash against globalisation and the left wing turn in the British Labour Party under Jeremy Corbin.
  • In Australia, we are seeing an intensification of the left right divide not seen since 1970s. The ALP is far from the economic rationalist policies of Hawke and Keating. Policies of higher taxes for the “big end of town” (bringing back the Budget Repair Levy and winding back various tax concessions), significantly increased spending on health and education, some reregulation of the labour market and talk of raising the minimum wage to become a “living wage” all suggest a populist focus reflecting a change in voter preferences. The same pressures are also evident in some ways in proposed intervention in the energy sector.

Qualifications

Of course, there are various qualifications to this leftward shift. First, it’s most evident in Anglo countries because it’s here that the swing to the right and economic rationalism was most pronounced in the 1980s and 90s and where inequality is more of an issue. Europe never fully bought into the supply side revolution of Thatcher and Reagan and inequality has not risen much. In fact, France under Macron looks to be embarking on its own version of Thatcherism (with the yellow jacket protests proving nothing more than that Macron is actually doing something) which should augur well for its long-term prospects if Macron stays the course. Second, it’s arguable that if the Democrats are to win the US presidential election next year they have to win the mid-west and a socialist presidential candidate may not cut it there. Third, even many on the left are sceptical of ever larger budget deficits – eg in Australia the ALP has been talking of a stronger budgetary position. Finally, there is an argument that a modest move left is necessary to curb the rise in inequality and so save capitalism – much as Keynesian economics “saved” it after the Great Depression.

But what does it all mean for investors?

The risk over time is that a more left leaning electorate will mean a tendency towards bigger government, bigger budget deficits, more regulation, higher effective top marginal tax rates, less globalisation and tougher rules on immigration in some countries. Or it may just mean a stalling in economic reforms. The risk is that it will act as another constraint on productivity and economic growth and eventually see higher inflation if the supply side of the economy suffers.

It’s worth putting this in context. The swing in the political pendulum to the right and the economic rationalist/supply side policies – of deregulation, privatisation, smaller government, tax cuts, low inflation, globalisation – that followed along with the peace dividend from the collapse of communism and attractively high starting point dividend yields and bond yields created a powerful tail wind that drove strong returns in shares and bonds starting in the early 1980s.

Now the environment is very different. Starting point investment yields are ultra-low for most assets and a reversal of economic rationalist policies in favour re-regulation, higher taxes and more government risk slowing productivity growth and eventually resulting in higher inflation.

The key point is that the powerful tailwind from the economic rationalist policies (deregulation, smaller government and globalisation) is now behind us and is contributing along with a range of other factors to a much more constrained return environment for investors. Our medium-term projection for the investment return from a balanced mix of assets have been steadily declining in recent years and is now running around 6.4% pa, which is down from over 10% a decade ago.

In this environment, there is a strong case to focus on investment strategies targeting the achievement over time of goals defined in terms of returns, investment income or whatever is required and using a flexible approach to do so as opposed to relying solely on set and forget strategies that depend heavily on market-based returns. There is also a case to look out for assets that may buck the trend of constrained returns as support for economic rationalist policies recede. French shares may be worth looking at!

SOURCE: https://www.ampcapital.com/au/en/insights-hub/articles/2019/march/millennial-socialism-and-the-swing-of-the-political-pendulum

Newsletter – 15th Mar 2019

March 15, 2019/0 Comments/in Archived, News /by Digilari

Dear Sir/Madam,

We are a little busy this month, hence the tardiness of our newsletter!

Rod wanted to start this newsletter off with his market update:

Over the last 6 months markets have experienced extreme volatility which some of you may have noticed if you have been checking your account balance. The last 3 months of 2018 was the worst finish to global sharemarkets since the great depression. On the other hand, the first 2 ½ months of 2019 has seen the best start to a calendar year on financial markets for 30 years. While markets have rallied, we are expecting continued volatility throughout the rest of this year.

In staff news, Monica has decided to take the big leap and start her own business. She will be doing the same work for us but also for other advisers. We wish her all the best and look forward to continuing our working relationship with her.

We also have our annual Golf Day coming up on Friday 24th March 2019. This year, we have had a change of venue and it will be at McLeod Golf Club at Mt Ommaney. Invitations will be sent to our golfing clients and if anyone else is interested in entering a team, please call the office.

Until next month,

Emma

Empowering women to own their finances

March 11, 2019/0 Comments/in Archived, Mortgage Finance /by Digilari

Money is still a taboo topic of conversation. Although we live in a world where our lives are digital and readily shared, talking about money is still off limits. But it shouldn’t be because having a keen grasp on personal finances is crucial.

On average, women earn 18.2% less than men for the same job. Their earning potential often takes a dive after they have children and, as a result, they retire with significantly less in superannuation than men. Strong financial literacy can be the difference between a woman reaching her financial goals or being left at the starting gate.

Yet too many women, no matter how smart and savvy, lack the confidence to truly own their finances. It can be hard to reach out and ask for advice.

With this in mind, and to commemorate International Women’s Day, MLC set out to break this taboo with a panel discussion featuring four female financial gurus – Financy Founder and CEO, Bianca Hartge-Hazelman; Corporate Super MLC and Plum General Manager, Helen Murdoch; MLC and Plum Superannuation Education Consultant, Martina Taylor; and MLC Director of SMSF and Investor Behaviour at NAB, Gemma Dale – who are also working mothers.

They shared practical tips on how they manage their money. So, what can you do today to get your finances into gear?

Have ‘the money talk’

Finance is the leading cause of relationship breakdown in Australia.

“A lot of people don’t want to talk about money – we’re happier to talk about sex, religion and even politics,” Martina says. But when it comes to your partner, there’s no substitute for a frank and open conversation about the shape of your finances. This means coming clean about income, joint accounts, goals and, of course, debt.

Bianca suggests being clear about the things you need to feel financially empowered in your relationship, such as open communication, and deal breakers like handing over full control of your assets. Being clear about these can help you both through tricky financial conversations and keep you on the same page.

It’s important to remember that people react differently when discussing money. If you’re worried about your partner feeling uncomfortable during ‘the money talk’, Gemma recommends thinking of your finances as “just numbers” to take the sting out of the conversation.

“If you can take the emotion out of it and just say ‘can we get the numbers on a page’, it makes it less anxiety-inducing,” she says.

While it can be uncomfortable to discuss, all our experts recommend having financial conversations early in your relationship and regularly.

“Transparency matters in a relationship and even more in a breakdown,” Gemma says. “But make sure you get help if you need it too.”

Log into your super

Many Australians have a mental block surrounding their superannuation and don’t think of it as their money. But super can be the most significant financial asset that you own.

“It’s very hard to get people thinking about retirement until they’re closer to it,” Helen says, “But we can only impact the future – not the past – and every little bit counts. Even just getting online, looking at your account balance and knowing that’s your money is really important.”

Martina says the question many women ask is: “How much should I aim to have in my super?” The oft-cited million-dollar number can make many people switch off because they don’t think it’s possible to accumulate that much in their fund.

“It’s a myth – you don’t need a million dollars,” she says. “Go to the MLC website and there’s content to help you work out a realistic target. This will help you think about the next phase.”

If you’re taking a career break or think it’s on the cards, Bianca says it’s critical to work out if your employer pays superannuation on parental leave. It’s also useful to think of innovative ways to top up your super while on leave.

“When I was on maternity leave, I used to match the cost of nappies each week in my superfund,” she says.

Do your research

Despite progress, the gender pay gap persists, putting an extra hurdle in front of women and their finances. A simple step women can use to improve their finances is to stop underselling themselves at work and ask for the salary they deserve.

Gemma suggests doing your research first. It’s often hard to divorce yourself emotionally from what you feel you deserve to be paid but, by understanding your industry, you can better illustrate your contribution – and your worth.

“You’ll have a more objective view of your worth and you’ll go into that conversation with more confidence,” she says.

Our experts don’t suggest sacrificing flexibility for pay. Increasingly, workplaces are becoming more flexible and they say there’s no reason you can’t enjoy that and a better salary.

Take a financial day out

Above all, our experts agreed it’s critical for women to engage in their finances if they want to be financially fearless. Bianca’s advice? Take a financial day out. Dedicate some time on a Saturday morning, or whenever you have time, to look at your overall finances.

Once you have a clear grasp of your income, liabilities, assets and expenses, it will become obvious what you need to focus on – whether that’s paying down debt, saving or investing.

Gemma suggests once you decide on a course of action, automate it. Using apps and technologies to take the decision-making out of the process makes it easier. “You’ll find in 12 months that mortgage will be paid down a little more, or you’ll have a saving account with a couple of thousand in it,” she says.

Helen agrees the first step in owning your finances is hardest, but it’s also the most important. “Work out what you want and then seek help,” she says. “Don’t be afraid to ask – nobody has all the answers but you’d be surprised how much advice is out there.”

SOURCE: https://www.mlc.com.au/personal/blog/2019/03/empowering_women_to_own_their_finances

Australia slides into a “per capita recession”

March 11, 2019/0 Comments/in Archived /by Digilari

Key points

  • Australian growth slowed even more in the December quarter. Growth may bounce back a bit this year, but the housing downturn will likely constrain it to around 2- 2.5%.
  • As a result, unemployment is likely to drift up and wages growth and inflation remain lower for longer.
  • The RBA is on track to cut rates this year and the housing downturn will likely see Australian shares continue to underperform global shares.

Introduction

Much has been made of Australia’s nearly 28 years without a recession. Despite many seeing recession as inevitable in response to the 1997 Asian crisis, the 2000-2003 tech wreck, the GFC and the “end” of the mining boom Australia has seemingly sailed on through each of these regardless. This has been thanks to a combination of economic reforms in the 1980s and 90s, the floating $A that falls whenever there is a major global problem providing a shock absorber, strong growth in China, desynchronised cycles across industry sectors and states, strong population growth and good luck. The question now is whether Australia’s luck has run out with housing turning down (and less economic reform in recent times)? While we see a constrained period for Australia as housing turns down, we still don’t see recession (albeit it’s a risk).

Australian growth has slowed again

December quarter GDP growth was just 0.2% quarter on quarter, with a fall in housing investment, weak consumer spending and business investment and a detraction from trade only partly offset by solid public demand.

Australian real GDP growth
Source: ABS, AMP Capital

Coming on the back of just 0.3% growth in the September quarter this is not good news. It means growth has slowed to 2.3% over the year to December and, even worse, annualised growth over the last six months has slumped to just 1%. It also means Australia has slipped into a “per capita” recession with GDP per person now falling for two quarters in a row, for the first time since 2006.

Housing downturn to be a significant drag on growth

The bad news is that growth is likely to remain under pressure as the housing downturn intensifies. Approvals to build new homes have fallen sharply. And while auction clearance rates have bounced at the start of the year we doubt this is the start of a recovery in house prices given the long list of negatives for house prices including: tight credit; the switch from interest only to principle and interest loans; record unit supply; issues around new building quality; an 80% or so collapse in foreign demand; fears that negative gearing and capital gains tax arrangements will be made less favourable if there is a change of government; and falling prices feeding on themselves. We see Sydney and Melbourne home prices falling another 15% or so as part of a total top to bottom fall of around 25% out to next year, which will see national average home prices have a top to bottom fall of around 15%. So far we are only about half way there.

We estimate that the housing downturn will detract around 1 to 1.5 percentage points from growth this year with:

  • a direct detraction from growth as the housing construction cycle turns down. This is likely to amount to around 0.4 percentage points per annum (which was what it added on average during the construction boom).
Building approvals are pointing to a fall in home building
Source: ABS, AMP Capital
  • reduced demand for household equipment retail sales as dwelling completions top out and decline.
  • a negative wealth effect on consumer spending of around 1-1.2% pa. Rising housing wealth helped drive decent growth in consumer spending in NSW and Victoria as households reduced the amount they saved as their housing wealth rose. This is now likely to go in reverse detracting around 0.7 percentage points from GDP growth.
  • there could also be a feedback loop into further bank credit tightening if non-performing loans and defaults rise as unemployment starts to rise.

The east coast drought could also act as an ongoing drag on growth with a “mild” El Nino hanging around although this may be mild at around a 0.2 percentage point growth detraction.

The weakness in relation to the domestic economy is evident in in weak profit results for domestically exposed companies in the recent December half year profit reporting season. While results were better than feared enabling shares to rise, the ratio of upside surprise to downside was its weakest since 2009, only 59% saw profits rise from a year ago and only 52% raised their dividends from a year ago which (notwithstanding “special” dividends from a few companies) indicates a lack of confidence in the outlook. While consensus expectations for profit growth for this financial year held at 4%, this was only because of an upgrade to resources profit growth to 14% with profit growth in the rest of the market falling to just 1%.

Proportion of Australian companies with profits up and raising dividends
Source: AMP Capital

Five sources of support for the economy
The risks to the economy from the property downturn are significant – particularly if unemployment rises sharply driving mortgage defaults and forced selling. However, there are five sources of support for the economy which should mean that a traditional (as opposed to a per capita) recession is unlikely:

  • First, the drag on growth from slumping mining investment (which averaged around 1.5 percentage points per annum) is fading as mining investment is close to the bottom.
Mining investment back down to normal
Source: ABS, AMP Capital
  • Second, surveys point to a recovery in non-mining investment. Business investment plans for next financial year are well up on plans a year ago.
Actual and expected capital expendature
Source: ABS, AMP Capital
  • Third, public infrastructure spending is rising solidly.
  • Fourth, demand for our exports is likely to improve through this year as global growth picks up led by China in response to stimulus measures and a likely fading of trade war risks.
  • Finally, policy stimulus is likely to help with the April Budget and election outcome likely to see some combination of tax cuts or increased spending (under Labor) from July and the RBA likely to cut interest rates.

Given the cross currents, we have revised our growth forecasts down to around 2-2.5% over the next year or so. So we see some pick up from the dismal second half 2018 pace and no recession but growth will still be well below potential and RBA forecasts.

Implications – higher unemployment/lower inflation

Growth around 2-2.5% won’t be enough to further eat into spare labour market capacity let alone absorb new entrants to the workforce so we see unemployment rising to around 5.5% by year end. This is consistent with slowing job vacancies already becoming evident. This in turn points to wages growth remaining weak. Meanwhile, it’s hard to see much uptick in inflationary pressure. The latest Melbourne Institute Inflation Gauge points to ongoing weakness in underlying inflation.

MI inflation gauge points to lower inflation
Source: ABS, Melbourne Institute, AMP Capital

RBA on track to cut rates

Against the backdrop of soft growth and inflation we continue to see the RBA cutting the cash rate to 1% this year. Rate cuts won’t be aimed at reinflating the property market but supporting households with a mortgage to offset the negative wealth effect. And banks will likely have no choice but to pass the cuts on given the bad publicity of not doing so.

Implications for investors

For investors this all means: bank deposit rates will remain poor; Australian bonds will continue outperforming global bonds; Australian shares are likely to remain relative underperformers compared to global shares as the housing downturn weighs; and with the RBA likely to cut and the Fed on hold the $A is likely to fall into the high $US0.60s.

SOURCE: https://www.ampcapital.com/au/en/insights-hub/articles/2019/march/australia-slides-into-a-per-capita-recession

Five great charts on investing – why they are particularly important now

February 20, 2019/0 Comments/in Archived /by Digilari

Key points

  • Successful investing should be simple but increasing rules, regulations, choices and social media are making it anything but. At its core, it is still simple though.
  • These five great charts focus on critical aspects of investing: the power of compound interest; the investment cycle; the roller coaster of investor emotion; the wall of worry; & time is on your side when investing.

Introduction

Investing seems to be getting more and more complex. Ever increasing complexity in terms of investment products and choices, regulations and rules around investing, the role of social media in amplifying the noise around investment markets and the increasing ways available to access various investments are all adding to this complexity. However, at its core, the basic principles of successful investing are simple. And one way to demonstrate that is in charts or pictures. This note revisits five charts I find useful in understanding investing. They are particularly pertinent in volatile and seemingly uncertain times like the present, so they are worth a revisit.

Chart #1 The power of compound interest

My love of this chart came out of my good friend and well-known economist, Dr Don Stammer, regularly espousing the importance of the magic of compound interest. And it is like magic – but many miss out because they are too busy looking for disasters around the corner or assuming that once disaster hits it will be with us indefinitely! What it shows is the value of $1 invested in various Australian assets in 1900 allowing for the reinvestment of dividends and interest along the way.

Shares versus bonds & cash over very long term - Australia
Source: Global Financial Data, AMP Capital

That $1 would have grown to $238 if invested in cash, to $906 if invested in bonds and to $532,739 if invested in shares. While the average return since 1900 is only double that in shares relative to bonds, the huge difference between the two at the end owes to the impact of compounding or earning returns on top of returns. So any interest or return earned in one period is added to the original investment so that it all earns a return in the next period. And so on. I only have Australian residential property data back to 1926 but out of interest it shows (on average!) similar long term compounded returns to shares.

Blowed if I know where it came from, but the “Law of 72” is useful way to understand how long it takes an investment to double in value using compounding. Just divide 72 by the rate of return and that’s the answer (roughly). For example, if the rate of return is 2% per annum (eg, the interest rate on a bank term deposit), it will take 36 years to double in value (= 72 divided by 2). But if it’s, say, 8% pa (eg, what shares may be expected to return over the medium-term including dividends), then it will take just 9 years (= 72 divided by 8).

Key message: to grow our wealth, we must have broad exposure to growth assets like shares and property. This is far more important than second order issues like which particular stocks to have in your share portfolio. While shares have been volatile lately and the short-term outlook for Australian housing is messy, both will likely do well over the long term.

Chart #2 The investment cycle lives on

The trouble is that shares can have lots of setbacks along the way as is particularly evident during the periods highlighted by the arrows on the share market line. The higher returns shares produce over time relative to cash and bonds is compensation for the periodic setbacks that they have. But understanding those periodic setbacks – that there will always be a cycle – is important in being able to not miss out on the higher returns that shares and other growth assets provide over time. The next chart shows a stylised version of the investment cycle.

The investment cycle

The investment cycle
Source: AMP Capital

The grey line shows the economic cycle from “boom” to “bust” to “boom” again. Just before the low point in the economic cycle, shares invariably find a bottom and start to move higher thanks to attractive valuations and easy monetary policy and as smart investors anticipate an eventual economic recovery. This phase usually sees scepticism and disbelief as economic conditions are still weak. Shares are eventually supported by stronger earnings as economic conditions improve, which eventually gives way to a blow off phase or euphoria as investors pile in. This ultimately comes to an end as rising inflation flowing from strong economic growth results in ever tighter monetary policy, which combines with smart investors anticipating an economic downturn and results in shares falling. Often around the top of the cycle real assets – like property and infrastructure – are a better bet than shares as they benefit from strong real economic conditions. But that’s not always the case. Once the downturn starts, bonds are the place to be as slowing growth gives way to falling inflation which sees bond yields fall producing capital gains for investors. At some point, of course, easing monetary conditions and attractive valuations see shares bottom out and the whole cycle repeats.

Key message: cycles are a fact of life and it’s usually the case that the share market leads the economic cycle (bottoming before economic recovery is clear and topping before economic downturn hits) and that different assets do best at different phases in the cycle. Of course, each cycle is a bit different. Some are short but some, like the big bull market in US shares since 2009, are long because the recovery is slow and so it takes longer to build up excesses that end the cycle.

Chart #3 The roller coaster of investor emotion

Its well known that the swings in investment markets are more than can be justified by moves in investment fundamentals alone – like profits, dividends, rents and interest rates. This is because investor emotion plays a huge part. The next chart shows the roller coaster that investor emotion traces through the course of an investment cycle. A bull market runs through optimism, excitement, thrill and ultimately euphoria by which point the asset class is over loved and overvalued and everyone who is going to buy has – and it becomes vulnerable to bad news. This is the point of maximum risk. Once the cycle turns down in a bear market, euphoria gives way to anxiety, denial, capitulation and ultimately depression at which point the asset class is under loved and undervalued and everyone who is going to sell has – and it becomes vulnerable to good (or less bad) news. This is the point of maximum opportunity. Once the cycle turns up again, depression gives way to hope and optimism before eventually seeing euphoria again.

The roller coaster of investor emotion

The roller coaster of investor emotion
Source: Russell Investments, AMP Capital

Key message: investor emotion plays a huge role in exaggerating the investment cycle. The key for investors is not to get sucked into this emotional roller coaster: avoid assets where the crowd is euphoric and convinced it’s a sure thing and favour assets where the crowd is depressed and the asset is under loved. Of course, doing this is easier said than done which is why many, if not most, investors end up getting wrong footed by the investment cycle. Getting sucked in during the good times only to panic out during the bad times.

Chart #4 The wall of worry

There is always something for investors to worry about. The worries ramped up last year with concern around inflation, the Fed, rising bond yields, trade wars, US politics and President Trump generally, Italy, the ongoing Brexit soap opera, Chinese debt and slowing growth, the surging and then plunging oil price and in Australia with the Royal Commission and falling home prices. And in a world where social media is competing intensely with old media and itself for attention on the nearest screen right in front of you it all seems more magnified and worrying than ever. But of course most of this stuff is just noise. The global economy has had plenty of worries over the last century, but it got over them with Australian shares returning 11.7% per annum since 1900, with a broad rising trend in the All Ords price index as can be seen in the next chart, and US shares returning 9.8% pa. (Note that this chart shows the All Ords share price index whereas the first chart shows the value of $1 invested in the All Ords accumulation index, which allows for changes in share prices and dividends.)

Australian shares have climbed a wall of worry
Source: ASX, AMP Capital

Key message: worries are normal around the economy and investment markets but most of them are just noise. It all seems louder and more worrying now because it’s getting magnified by social media screaming for attention. Try to turn it down.

Chart #5 Time is on your side

In the short term, investment markets bounce all over the place. Even annual returns in the share market are highly volatile, but longer-term returns tend to be solid and relatively smooth as can be seen in the next chart. Since 1900, for Australian shares roughly two years out of ten have had negative returns but there are no negative returns over rolling 20-year periods. (It’s roughly three years out of ten for US shares since 1900.)

Australian share returns over over rolling 12 mth & 20 yr periods
Source: Global Financial Data, AMP Capital

Key message: the longer the time horizon, the greater the chance your investments will meet their goals. So in investing, time is on your side and its best to invest for the long term.

SOURCE: https://www.ampcapital.com/au/en/insights-hub/articles/2019/february/five-great-charts-on-investing-why-they-are-particularly-important-now

Why growth in China is unlikely to slow too far and why it needs to save less and spend more

February 7, 2019/0 Comments/in Archived /by Digilari

Key points

  • China’s economy is slowing but not collapsing as the services sector holds up. A further slowing is likely in the short term, but policy stimulus is likely to see growth improve in the second half, giving 2019 growth of 6.2%.
  • Concerns about China’s rapid debt growth are overstated given it reflects high (not low) savings.
  • Chinese shares are cheap but expect short term volatility.
  • Reasonable Chinese growth is a positive for the Australian economy. The housing downturn will dominate though, pushing the RBA to cut rates and this will see the $A fall further into the $US0.60s.

Introduction

Scepticism about China’s economic success amongst (mostly western) investment commentators has been an issue for as long as I can remember. The current China worries mainly relate to slowing growth, high debt and the trade dispute with the US. China is now the world’s second largest economy and its biggest contributor to growth so what happens in China has big ramifications globally. This is particularly so in Australia as China is its biggest export destination. This note looks at the main issues and what it means for investors and Australia.

Is growth slowing a little or a lot?

China slowed through 2018. GDP growth for the whole of 2018 came in at 6.6% which was a bit above our expectation of 6.5%, but it was down from 6.8% growth in 2017 and momentum slowed to 6.4% year on year in the December quarter. Some commentators argue that China’s actual GDP growth is much weaker – maybe just half the reported rate. The argument often runs along the lines that the GDP data comes out too early after the end of each quarter, it’s too smooth to be believed and that it’s made up to suit the annual growth target. This speculation has long been around and I’ve always thought it’s a bit of a distraction: it stands to reason that emerging countries like China have less to spend on stats so they may be less accurate than in rich countries, and if China’s economy is really a lot smaller than it claims then why is the rest of the world so concerned about a slowdown in its economy? And why is the US concerned about its rising economic clout? The bottom line is that it’s all too academic to get too hung up on and so I tend to see the GDP data as a rough, but admittedly imperfect, guide.

So what does other data say? As can be seen in the next chart, growth in industrial production, retail sales and fixed asset investment all slowed through 2018 to multi-year lows, albeit it’s all still pretty solid compared to most other countries.

Chinese activity indicators
Source: Thomson Reuters, AMP Capital

Annual growth in exports and imports also went negative in December and the weakness in exports could have further to go given that they were arguably artificially boosted as Chinese exporters/US importers sought to “front run” US tariffs.

Chinese export and import growth has turned negative
Source: Bloomberg, AMP Capital

Chinese manufacturing conditions PMIs have also fallen sharply. See the next chart.

Chinese manufacturing down, but services up
Source: Bloomberg, AMP Capital

For those sceptical of official Chinese data, I have shown the private sector Caixin survey but it’s a similar message from the official PMI survey, ie manufacturing has slowed.

While concerns about the trade war may have contributed to the slowdown, the main driver so far appears to be tighter credit conditions aimed at slowing debt growth via the less regulated “shadow banking” system. This would explain why smaller businesses are doing it tough relative to larger businesses.

However, it’s not all doom and gloom. First, the housing sector has been doing well with house prices rising.

Chinese residential property prices - just another cycle
Source: Bloomberg, AMP Capital

Second, while manufacturing has slowed, services has continued to hold up well. This is evident in relatively solid readings for the services conditions PMIs (in both the official and Caixin PMIs) of around 54 in contrast to weaker manufacturing PMIs – see the second chart above. Services are less affected by trade wars and the services sector is expanding relative to the manufacturing sector. Out of interest this may partly explain why GDP growth in China is now smoother and does better than expected with most commentators focusing on the old manufacturing sector.

Finally, policy stimulus is ramping up…

Policy easing

In response to the growth slowdown, China has moved to start providing significant policy stimulus with the People’s Bank of China cutting the required reserves that banks have to keep (allowing them to lend out more) and the government recently announcing fiscal stimulus focused on tax cuts for households and small businesses but also infrastructure spending amounting in total to 2-3% of GDP for this year. With public debt and inflation relatively low there is little constraint on policy stimulus except to avoid another big ramp up in debt, which is why stimulus is now more focused on tax cuts than debt-related investment. Which in turn means more of a boost to services demand in China than to global commodity demand and a less certain impact than was seen from the 2008 and 2015-16 stimulus programs.

Growth and inflation outlook

We expect Chinese growth this year to slow further in the short term particularly as exports weaken after front running, but policy stimulus should help head off a deeper downturn and see growth improve in the second half. But it’s more aimed at preventing a sharp downturn in growth rather than pushing growth a lot higher. So overall growth is expected to be around 6.2% this year which is still a bit slower than last year’s 6.6% growth rate. Inflation is likely to remain low.

What about China’s “debt time bomb”?

This is the most commonly expressed concern about China, with the ratio of non-financial debt to GDP having increased very rapidly from around 150% a decade ago to nearly 300% now. This has caused some to fear a financial catastrophe for China. However, China’s debt problems are different to most countries. First, China has borrowed from itself – so there’s no foreigners to cause a foreign exchange crisis. Second, much of the rise in debt owes to corporate debt that’s partly connected to fiscal policy and so the odds of a government bailout if things go wrong are high. Finally, the key driver of the rise in debt in China is that it saves around 45% of GDP (roughly double that in developed countries) and most of this is recycled through the banks where it’s called debt. So unlike other countries with debt problems, China needs to save less and consume more, and it needs to transform more of its saving into equity rather than debt. Chinese authorities are aware of the issue and overall growth in debt has slowed but slamming on the debt brakes without seeing stronger consumption makes no sense. But boosting consumption will take time and will involve moving to a more progressive tax system and enhanced social welfare.

What about the trade war?

While the tariff increases that have actually been implemented so far in the US/China trade war are relatively small the threat of more to come has clearly adversely affected confidence (and thus investment) in both countries. Trade negotiations between the US and China are reportedly progressing well but big differences apparently still remain. The pressure from slowing growth on both sides means that both China and the US are under pressure to reach a deal though – notably President Trump who doesn’t want to see recession or an extended bear market derail his 2020 re-election prospects. As such we see roughly an 80% chance that a deal is reached – either before the March 1 deadline for negotiations or after an extension.

The Chinese share market

Chinese shares have bounced 9% from their December low. But they had a 32% top to bottom fall last year and are still cheap trading on a price to forward earnings ratio of just 10 times (compared to 14.7 times for Australian shares) which is about as cheap as they ever get. See the next chart.

Chinese shares have bounced, but remain cheap
Source: Thomson Reuters, AMP Capital

They may have a short-term pullback as growth slows further in the first half, but with valuations cheap they should perform well on a 12-month horizon as growth and hence profits improve through the second half.

Implications for Australia

A sharp slowdown in China would be a double whammy for the Australian economy coming at the same time as the housing downturn. But while it’s a risk it’s not our base case. Rather our outlook for China’s economy to stabilise and growth to pick up a bit in the second half implies a reasonable – but not spectacular – outlook for commodity prices. Combined with the spike in iron ore prices on the back of Vale’s problems (albeit temporary) it points to reasonable growth in export earnings, which will be one source of support helping to counter the housing downturn. Reasonable commodity prices will help prevent a sharp drop in the $A, but we still see it falling into the $US0.60s as the RBA cuts the cash rate to 1% this year.

SOURCE: https://www.ampcapital.com/au/en/insights-hub/articles/2019/february/why-growth-in-china-is-unlikely-to-slow-too-far-and-why-it-needs-to-save-less-and-spend-more

Newsletter – 7th Feb 2019

February 7, 2019/0 Comments/in Archived, News /by Digilari

Dear Sir/Madam,


Happy (belated) New Year to all of our clients!

The office is well and truly back into the swing of things after a relaxing holiday break with our families over the Christmas period. To celebrate another year, we enjoyed a lovely afternoon watching the horses.

As mentioned in one of our previous newsletters, we have decided that each month we will include a story regarding one of our clients. If you have a story or photos to share, please get in touch and we will include them in future newsletters.

This month, Rod would like to share with you some pictures that our clients, Joe and Raeleen took when they travelled last year to see the wildflowers in WA.

The global and domestic issues that Rod raised in the December newsletter are continuing to create volatility in economies and sharemarkets. The good news is that sharemarkets stopped dropping at the end of December and so far 2019 has been a positive one although there is still some way to go before markets have fully recovered from what happened in the last few months of 2018. Rod is expecting continued volatility and most likely returns of less than 10% for this calendar year.

Until next month,

Emma

Australian housing downturn Q&A – how bad will it get?

January 23, 2019/0 Comments/in Archived /by Digilari

Key points

  • Australian home prices are likely to fall another 5-10% this year driven by a further 15% or so fall in Sydney & Melbourne. Tight credit, rising supply and falling price expectations are the main negatives.
  • Uncertainty around the impact of possible tax changes is likely also impacting investor demand.
  • The housing downturn will be a significant constraint on Australian growth. We expect the RBA to cut the official cash rate to 1% this year.

Introduction

The housing cycle and house prices always incite high interest in Australia. Until recently it was all about surging prices and poor affordability – particularly in Sydney and Melbourne. Over the last year it’s turned into how far prices will fall and what’s the impact on the economy. Global issues and the election aside, the housing downturn is likely to be the main issue for Australia in 2019. This note provides a Q&A on the main issues.

How far have home prices fallen?

According to CoreLogic data, up until December capital city dwelling prices are down 7% from their September 2017 high. This masks a wide range though with Sydney down 11% from its July 2017 high, Melbourne down 7% from its November 2017 high, Perth down 16% and Darwin down 25% from their mid 2014 mining investment boom highs but other cities continuing to trend up to varying degrees. Recently the declines have been led by Sydney and Melbourne. House prices are on average down more than unit prices and prices in regional centres have generally held up better than capital cities.

Falling capital city home prices, led recently by Sydney and Melbourne
Source: CoreLogic, AMP Capital

What is driving the falls?

The fall in property prices comes after a boom – most recently over the five years to 2017 that in particular saw Sydney prices rise 72% and Melbourne prices gain 56%. This, on top of gains since the mid-1990s, saw a sharp deterioration in affordability, prices become overvalued relative to income, rents and their long-term trend and reach expensive levels by global standards. The surge in home prices went hand in hand with a surge in debt that has seen the ratio of household debt to income go from the low end of OECD countries to the top end. High prices and high debt left Australian housing very vulnerable. What has changed in the last two years is that:

  • It’s become harder to get a loan as regulators forced banks to tighten lending standards and the Royal Commission seems to have made banks even more cautious.
  • A big pool of interest only borrowers are switching to principal and interest driving higher debt servicing costs.
  • Banks have cut lending to SMSF funds to invest in property.
  • The supply of units has surged to record levels.
  • Foreign demand has fallen sharply.
  • As rising prices fed on themselves by driving expectations for more price gains (FOMO – fear of missing out), falling prices are driving reduced price expectations and leading to reduced demand and FONGO (fear of not getting out).
  • Investors are starting to factor in less favourable negative gearing and capital gains tax arrangements if there is a change of government.
  • Problems regarding the Lacrosse and Opal buildings have dented confidence around building standards.
  • Its unlikely interest rate cuts will quickly end this property cycle downturn as occurred in the 2008 and 2010-12 downswings. Rates are already low & debt is much higher.

What will be the impact of tax changes?

The Australian Labor Party’s policy since the last election has been to limit negative gearing to new property and double capital gains tax on investments held for more than 12 months. This is aimed at improving housing affordability which means lower prices. Put simply, such changes would make it less attractive for investors to invest in residential property which would be negative for prices. A study by Riskwise Property Research and Wargent Advisory found that this would lower property prices ranging from 2 to 3% in Tasmania to around 9% in Sydney. While the tax changes are proposed to be grandfathered, it’s likely it’s already reducing investor demand as investors worry that when it comes time to sell their property if the tax changes occur then there will be less demand.

How far will home prices fall?

For Sydney and Melbourne our base case has been that prices would have a top to bottom fall of around 20% out to 2020. However, the further plunge in auction clearance rates and acceleration in price falls late last year suggest a deeper fall possibly of around 25% (although it’s impossible to be precise). This suggests around another 15% fall in Sydney and more in Melbourne. A 25% top to bottom drop would take prices back to where they were in late 2014/early 2015.

Sydney action clearance rate and home price growth
Source: Domain, AMP Capital

While prices in other cities are being affected by credit tightening they were less speculative and so are less vulnerable. Perth and Darwin have already seen prices fall back to decade ago levels. Other capital cities and regional centres generally didn’t have a boom and so are unlikely to have a bust. So for the rest of Australia flat prices to modest gains are likely. Taken together this suggests a top to bottom fall in national average prices of 10 to 15%, with another 5 to 10% this year.

Will home prices crash?

This is a bit of an unhelpful question like the “are we in a property bubble” questions of a few years ago as it’s hard to define and implies a degree of inevitability in terms of the implications. A 25% plunge in Sydney and Melbourne may seem like a crash but given the extent of the prior gains it’s arguably not. But a 25% national average fall would probably be interpreted as a crash. Our assessment is that this is unlikely unless we see much higher interest rates or unemployment (neither of which are expected) driving a sharp rise in defaults and forced property sales or a collapse in immigration (which would collapse demand). Strong population growth is still driving strong underlying demand for housing. While mortgage stress is a risk, it tends to be overstated, and is unlikely to be a generalised issue unless interest rates or unemployment shoot higher. And, while Sydney and Melbourne are at risk, other cities have not seen the same boom & so are unlikely to crash.

Although many like to make comparisons to the US at the time of the GFC, there are two big differences. Australia has not seen the surge in sub-prime loans where money was lent to home owners who often had “no income, no job, no asset” (NINJA loans). Secondly, our mortgages are full recourse meaning we won’t see “jingle mail”, where home owners can send back the keys just because the house value falls below their debt, which then saw the bank put the property back on the market pushing home prices even lower.

However, the risk of a crash cannot be ignored given the danger that banks may become too tight and that investors decide to exit in the face of falling returns.

Have home prices fallen before?

A common property myth is that prices only ever go up and never fall. But a simple look at history tells us this is not so. Real house prices (ie prices after the impact of inflation) in Sydney fell 36% in 1934-35, 32% in 1937-41, 41% in 1942-43, 12% in 1947-48, 14% in 1951-53, 12% in 1961-62 and 22% in 1974-77. In nominal terms based on CoreLogic data Sydney dwelling prices fell 25% in 1980-83, 10% in 1989-91, 8% in 2004-06 and 7% in 2008-09. So a 25% fall this time around would be similar to that seen in the early 1980s.

What will be the impact on the economy?

The housing downturn will affect the broader economy via slowing dwelling construction, negative wealth effects on consumer spending (ie, our wealth goes down, we feel poorer, we spend less than otherwise) and if rising defaults drive a further slowing in bank lending. The first two will detract 1 to 1.5 percentage points from economic growth. Growth in infrastructure spending and business investment should help keep the economy growing but its likely to be constrained to around 2.7% which in turn will keep wages and inflation low.

Building approvals are pointing to a fall in home building
Source: ABS, AMP Capital

What is the impact on banks?

The main risk for banks is that the property downturn drives a rise in defaults. However, full recourse loans mean that just because home prices fall resulting in negative equity, defaults won’t necessarily rise. In the absence of much higher interest rates or unemployment making it harder for people to service their loans, a big rise in defaults is unlikely. However, it’s still a risk and the housing downturn will likely mean slower bank lending which will constrain bank profits.

What will it mean for interest rates?

Constrained growth due to the housing downturn resulting in lower for longer inflation will likely drive the RBA to cut interest rates this year, with two cuts taking the cash rate to 1% by year end. Our base case is that this will occur in August and November (giving the RBA chance to assess the election and tax cuts), but soft data could see it come earlier. Tax cuts from July are unlikely to be big enough (the Government is allowing for just $3bn pa in tax cuts which is just 0.1% of GDP) to head off the need for rate cuts.

Is the house price downturn good or bad?

This depends on who you are. For baby boomers who got in years ago, have paid off their debt and saw the value of their home rise to levels they never believed sustainable, a fall back to 2014/15 levels may be no big deal. For those who got in more recently and have a big mortgage price falls are more of a downer and its this group for whom negative wealth effects will be greatest. For millennials trying to get in its great news – assuming the housing downturn is not so great that it knocks the economy for six and they lose their jobs. For investors…

What does it mean for investors?

Over the very long-term, residential property adjusted for costs has similar returns to Australian shares. So, there is a role for it in investors’ portfolios. However, right now the slump in property prices in some cities is bad news for investors given that rental yields are often just 1-2% after costs. Falling rents in Sydney are a double whammy. Add to this uncertainty about tax and it’s not a great time for a property investor. That said, other cities and regional centres offer more attractive rental yields than Sydney and Melbourne and falling prices in Sydney and Melbourne will throw up opportunities at some point.

SOURCE: https://www.ampcapital.com/au/en/insights-hub/articles/2019/january/Australian-housing-downturn-QA-how-bad-will-it-get

The 2018 year in review: a confident start but a volatile finish

January 15, 2019/0 Comments/in Archived /by Digilari

John Owen, Portfolio Specialist, NAB Asset Management

A challenging year for investors, with rising uncertainty

Markets began the year with considerable optimism. The global economy was performing well, underpinned by strong growth in the US and China and evidence of recovery in Europe and Japan, while President Trump’s corporate and personal tax cut reforms helped drive US corporate earnings and market momentum. For much of the year, investors downplayed risks such as rising interest rates, ‘quantitative tightening’ in the US and withdrawal of monetary stimulus in Europe, escalating trade tensions and elevated valuations in markets.

However, this complacent attitude ended abruptly in the final quarter. Markets became alarmed about the impact of further US interest rate rises, mixed news on the global economy (notably on Chinese growth), the potential failure of the trade truce between the US and China and rising political risk. Severe market volatility resulted in the worst year for share market returns since 2008. The new year begins with considerable uncertainty about the investment outlook.

Despite this, Table 1 shows that longer-term returns across a range of asset classes are still pleasing.

Table 1: Mainstream asset class returns in Australian dollars – periods to 31 December 2018

Asset class Returns* 1 yr Returns* 3 yrs (pa) Returns* 5 yrs (pa) Returns* 10 yrs (pa)
Cash 1.9% 1.9% 2.2% 3.1%
Australian bonds 4.5% 3.7% 4.7% 5.2%
Global bonds (hedged) 1.6% 3.5% 4.8% 6.4%
Australian property securities 3.3% 7.6% 12.5% 10.7%
Global property securities (hedged) -3.0% 4.2% 8.0% 12.6%
Australian shares -2.8% 6.7% 5.6% 9.0%
Global shares (hedged) -7.4% 7.6% 7.5% 12.3%
Global shares (unhedged) 1.2% 8.4% 10.0% 9.9%
Emerging markets (unhedged) -4.7% 10.9% 7.0% 8.3%

Benchmark data: Bloomberg AusBond Bank Bill Index (cash), Bloomberg AusBond Composite 0+ Yr Index (Aust bonds), Bloomberg Barclays Global Aggregate Index Hedged to $A (global bonds), S&P/ASX200 A-REIT Total Return Index (Australian property securities), FTSE EPRA/NAREIT Developed Index (net) hedged to $A (global property securities), S&P/ASX200 Total Return Index (Aust shares), MSCI All Country World Indices hedged and unhedged (net) in $A (global shares), and MSCI Emerging Markets  (net, unhedged)

* Annualised returns. Past performance is not a reliable indicator of future performance.
Sources: FactSet, NAB Asset Management Services Limited.


Global growth moderated as the year progressed

While conditions in the global economy were generally favourable for much of the year, the outlook for 2019 is less certain as signs of slower growth in Europe and Asia emerged towards the end of 2018. Unlike the beginning of 2018, when growth was synchronised across the globe, 2019 begins with marked differences between regions and countries.

The US

The US economy enjoyed another year of strong growth, with economic indicators at the end of the year as positive as they were at the beginning. 2018 started well as a result of President Trump’s company and income tax cuts and substantial government stimulus. US corporate profit growth reached 25% annualised growth in the third quarter of 2018. An obvious sign of the economy’s strength was the progressive fall in the unemployment rate to 3.7%, which is near a fifty-year low. The tight labour market has given American workers more bargaining power, with the November US payroll report indicating average hourly wages grew 3.1%, the largest gain in nearly ten years. Wages growth, good job creation and enhanced job security helped underpin consumer sentiment and growth in retail sales.

The US Federal Reserve (the Fed) responded to these buoyant conditions by continuing to raise interest rates to keep inflation in check. The Fed increased the target federal funds rate by 0.25% four times during the year, to close at 2.25%−2.5%. In December, the Fed signalled the pace of rate increases would be more gradual in 2019. The Fed also maintained its ‘quantitative tightening’, selling US$50 billion of securities each month to reduce the US$4.5 trillion of US bonds and mortgage backed securities it had built up on its balance sheet since the GFC. This is a significant withdrawal of liquidity from markets.


Europe

After an encouraging start, economic conditions in Europe softened as 2018 progressed. The growth slowdown was broadly based, with Germany’s export-oriented economy particularly affected. Germany’s economy contracted by 0.2% in the third quarter, the first negative quarter in over three years. The growth of other economies also slowed. Economic concerns intensified later in the year due to the fragile state of the Italian economy, which is burdened by excessive debt, high unemployment and a weak banking system. After months of uncertainty, Italy’s populist coalition government reached agreement with the European Commission over proposed budget stimulus measures. Still, Italy’s economic and financial status remains precarious and could be an enduring source of concern for markets in 2019.

Europe’s slowdown is troubling markets because interest rates are already at very low levels. This means the European Central Bank (ECB), and policy makers generally, have limited ability to launch stimulus measures, if they become necessary. Despite this, the ECB concluded its quantitative easing program in December as planned.


The United Kingdom

In the UK, there were intense negotiations to reach a Brexit arrangement acceptable to both the UK and the European Union. However, 2018 closed with diminishing hope that an orderly withdrawal will be possible. A withdrawal agreement negotiated late in the year between Prime Minister Theresa May and the European Union was to have been ratified by the UK Parliament in December but the vote was deferred until January 2019 because there was little chance it would pass. If the re-scheduled vote fails, there is a real chance that an agreed Brexit withdrawal may not be in place on 29 March, the exit date. The uncertainty created by Brexit and consequent political instability has taken its toll on parts of the economy and affected the UK’s financial markets more than it has impacted global markets (so far). For example, business investment weakened in each of the first three quarters of 2018, and the Bank of England increased its policy rate in August as the pound’s depreciation led to inflation rising above its 2% target.


Japan

Despite years of substantial monetary stimulus and good growth in exports, Japan’s economy slowed and continues to lag the growth of other economies. Prices remain subdued, with inflation running near 1%. Although Japan’s unemployment rate is lower than America’s, there has been minimal growth in wages. This has contributed to slow domestic consumption growth. With interest rates close to zero, the Bank of Japan has little ammunition if the economy weakens further.
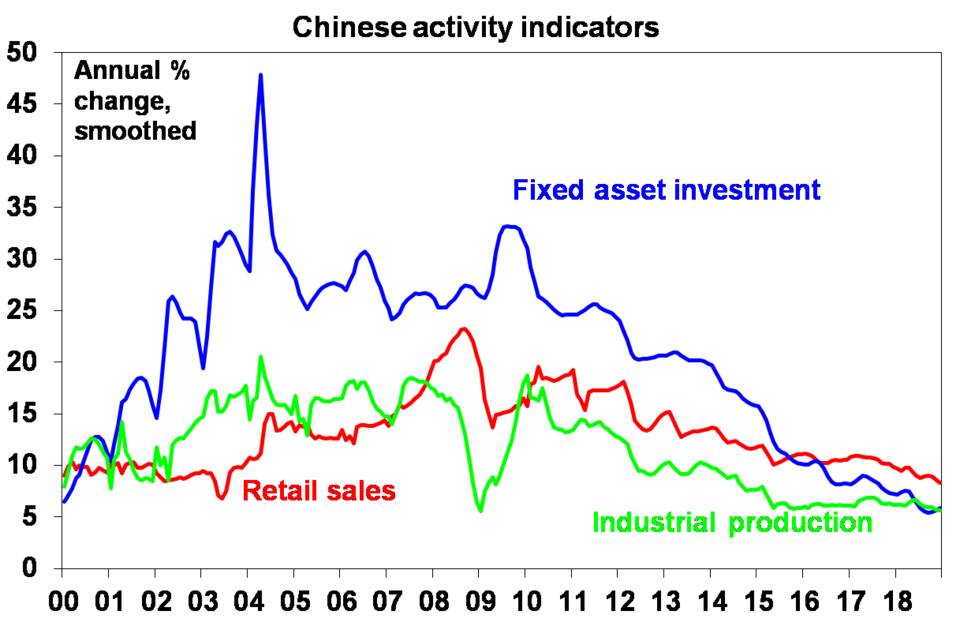
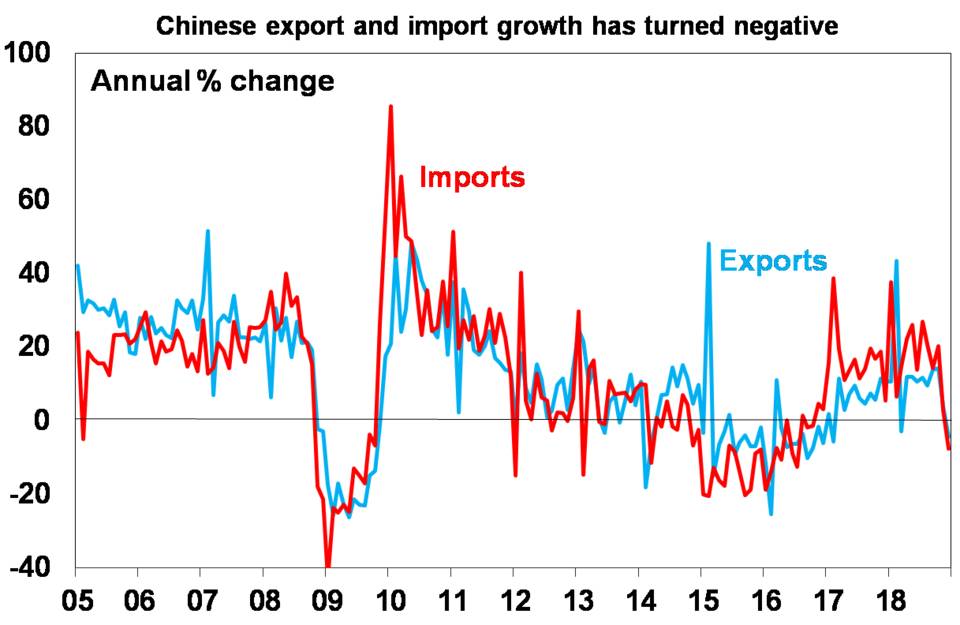
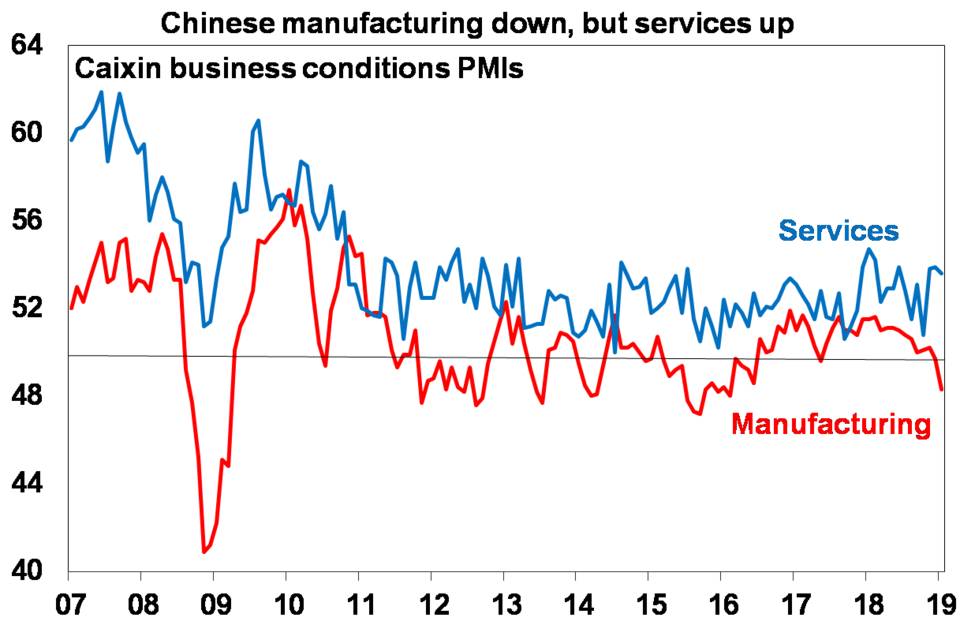
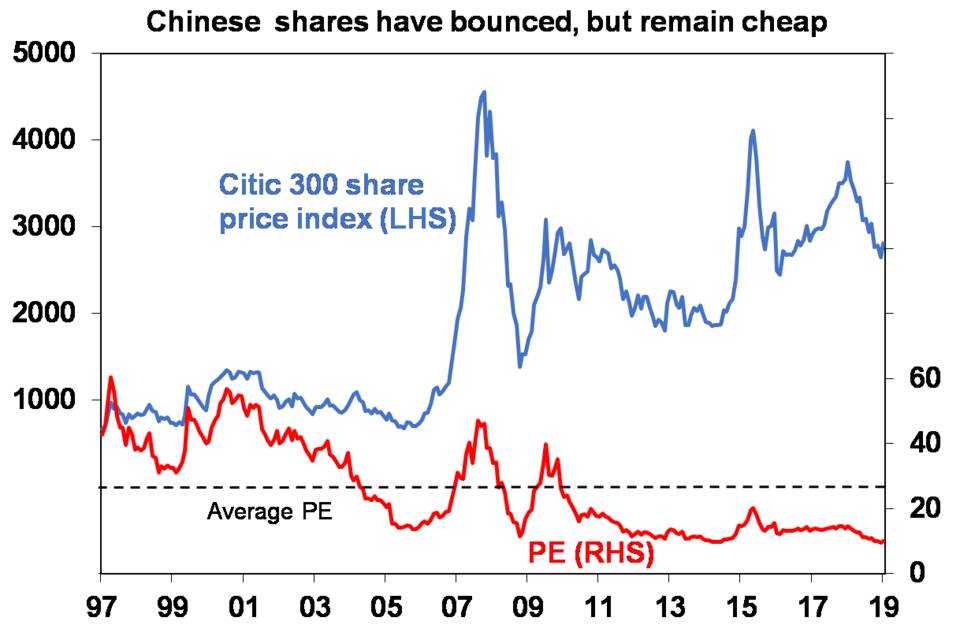

China

While it’s never easy to make a conclusive assessment of economic conditions in China, economic indicators suggest that growth moderated over the year. This was partly due to policy action by the central bank to underpin China’s financial stability by curbing credit growth. However, since mid-2018, Chinese authorities have implemented some targeted fiscal and monetary initiatives to support growth and lessen the impact of US tariffs. The trade dispute with the US has initially been unexpectedly beneficial to China’s trade performance, with exports to the US increasing 13% in the ten months to October compared with the same period in 2017. However, this was due to US importers bringing forward orders to escape new or higher tariff rates. This raises concerns for Chinese exports in 2019, especially if the trade ceasefire ends and the US resumes its program of tariff protection.

Trade tensions worsened through the year

Friction over trade escalated as the year wore on. Threats made by President Trump a year ago to impose tariffs to address America’s substantial trade deficit became a reality in 2018. After announcing in March that imports of steel and aluminium would attract a 25% tariff, in June the Trump administration imposed tariffs on Chinese imports totalling US$50 billion. China responded in the same way, targeting a range of US imports including aircraft, vehicles and agricultural products. In September, President Trump ordered the imposition of a 10% tariff on a further US$200 billion of imports from China.

A welcome attempt to reduce simmering trade tensions between the two economic superpowers occurred at December’s G20 summit. President Trump and China’s President Jingping agreed to reopen trade discussions and delay further tariff changes for 90 days, beginning on 1 January 2019. However, markets remain sceptical that a permanent reconciliation is possible because there remain significant differences between the two over issues such as intellectual property theft and cyber security. There are also lingering concerns that the Trump administration’s tariff policy could be extended to European car exports.

Volatility in the final quarter meant a disappointing year for global share investors

Share markets began the year with positive sentiment due to favourable global economic conditions and growth in corporate earnings, especially those in the US following company tax cuts. However, markets were rattled in the March quarter by higher than expected US wages data, which led to concerns the Fed may need to raise US interest rates more aggressively to keep inflation in check. The Trump administration’s decision to proceed with threatened tariff measures, targeting a range of products and Chinese imports in particular, also unsettled markets.

This uncertainty and market weakness proved short lived. Share markets in developed countries resumed their upward trend after March, although the length and breadth of the recovery was by no means consistent. The US enjoyed the most prolonged upswing, with buoyant economic conditions in the US and strong growth in company earnings pushing the market to its peak in September, when Japan’s Nikkei index also reached its high point for the year. By contrast, the recovery in European markets faltered by May due to global trade concerns, uncertainty created by the Italian budget impasse, the parlous state of the Italian economy and emerging signs that Europe’s economy had passed its peak.

Market sentiment worsened in the December quarter, resulting in considerable volatility in markets.  Some severe falls pushed the returns of many markets into negative figures for the year. Global shares returned -7.4% for the year on an Australian dollar hedged basis, while the higher 1.2% unhedged return largely reflected the 10% fall of the Australian dollar against the US dollar. Following its 13.7% fall in the December quarter, the US S&P500 index returned -4.9% (in local currency terms) in the year, while Japan’s Nikkei index was down by 10.3%. In Europe, markets in Germany and France were down by 18.3% and 8.0% respectively. Elsewhere in Asia, Hong Kong’s Hang Seng index was down by 13.6% and China’s SSE composite index fell 24.6%.

The emerging markets sector endured a challenging year due to higher US interest rates, the strong US dollar and tightening global liquidity. Many investors chose to reduce riskier exposures such as emerging markets, particularly those in Latin America and Eastern Europe. Worst affected were emerging countries that are dependent on foreign capital, as higher US interest rates led to an outflow of capital from their economies back to the US. The higher US dollar has also exacerbated difficulties for those countries with borrowings denominated in US dollars. At the more severe end of the scale, Turkey and Argentina are experiencing economic downturns and very high inflation.


Our share market also lost ground, but outdid most major markets

Australian shares returned -2.8% in 2018, a markedly different result from the 11.8% return in the 2017 calendar year. In contrast to recent years, our market outperformed many of its developed global peers.

Performance varied across industry sectors. The Health Care sector was the strongest and most consistent outperformer for much of the year, rising 19.3% due to the superior earnings performance of a number of companies like CSL Limited. Information Technology (up 7.3%) was another strong performer, though it is a very small part of the Australian market.

However, the Telecommunications Services sector fell 17.9% as intense competition adversely impacted company profits, with Telstra forced to cut its dividend. Numerous headwinds adversely impacted the Financials ex-Real Estate Investment Trusts sector, which fell by 9.7%. The Royal Commission into Misconduct in the Banking, Superannuation and Financial Services Industry was clearly a negative influence due to the adverse evidence it revealed. The market remains wary of possible recommendations by the Royal Commission that may result in substantial remediation, compliance costs and tighter lending standards. These increased costs will affect the profitability of financial institutions.

The Energy sector fell 21.3% in the December quarter and 8.6% over the year as slower global growth and elevated supply caused the Brent crude oil price to fall 19.6% during the calendar year. The Utilities sector fell 5.1%. Aside from the weaker oil price, utilities companies in the sector have become a political target, with calls for greater regulation to reduce the cost of power for Australian households.

Another mixed report card for Australia’s economy

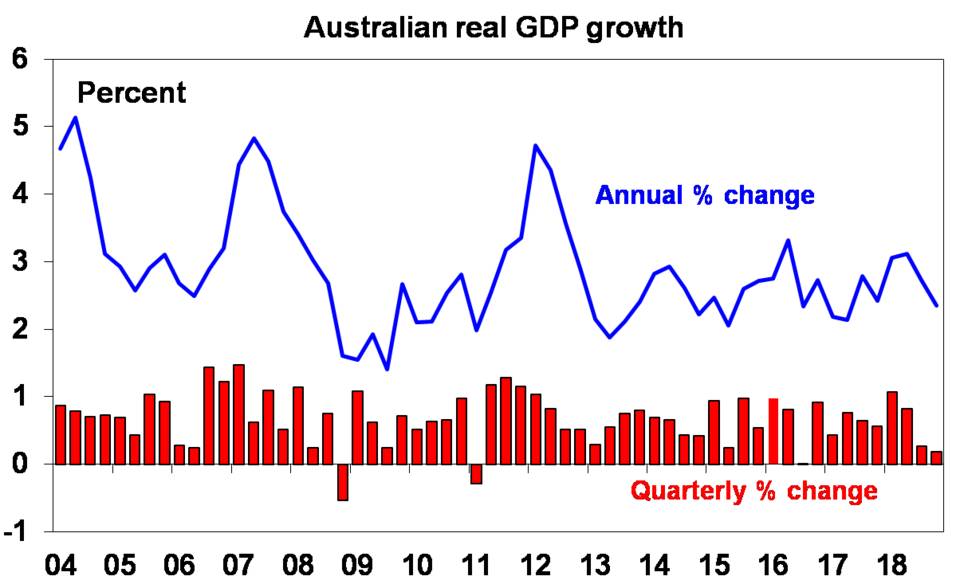
Domestic economic conditions improved further in 2018, though economic statistics were more robust in the first half of the year than the second. By mid year, economic growth had picked up to 3.4% for the year, its fastest annual rate since 2012. However, Australia’s gross domestic product grew only 0.3% in the September quarter compared with 0.9% the previous quarter, which reduced the annual growth rate to 2.8%.

One positive feature of the year was the continued improvement in Australia’s labour market, raising hopes that wages growth may finally improve. After starting the year at 5.5%, strong jobs growth saw Australia’s unemployment rate fall to 5.1% at 30 November, the lowest in six years. The unemployment rate is close to the estimate of the Reserve Bank of Australia (RBA) of full employment (5%). This suggests spare capacity in the labour market has diminished to the point where wages growth should start to recover. Encouragingly, wages growth picked up to a 2.3% annual pace for the September quarter, the highest in the last three years. However, the underemployment rate, which measures the part-time workers who want to work longer hours, remains high at 8.5% (at 30 November).

An improvement in wages growth is long overdue for the average Australian household, which is carrying a high level of debt and faces rising costs for non-discretionary items like healthcare and utilities. However, consumers remain cautious, with real retail sales growth averaging just 2.3% in the last couple of years. The modest pace of income growth has forced many households to reduce their savings to maintain consumption. The household saving ratio declined to 2.4% in the September quarter, the lowest saving rate since December 2007.

Despite these cost pressures for households, overall inflation remains low, with the annual rate of inflation running at 1.9% in the September quarter. Low inflation has allowed the RBA to keep the cash rate at 1.5% since August 2016. The RBA expects inflation will rise very gradually in the next few years, which means the cash rate is likely to remain stable well into 2019.

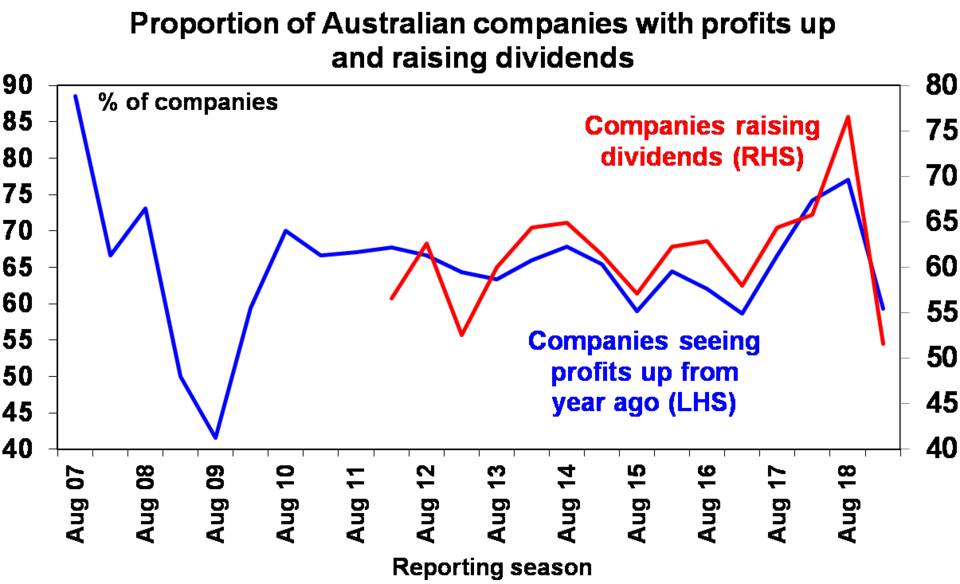
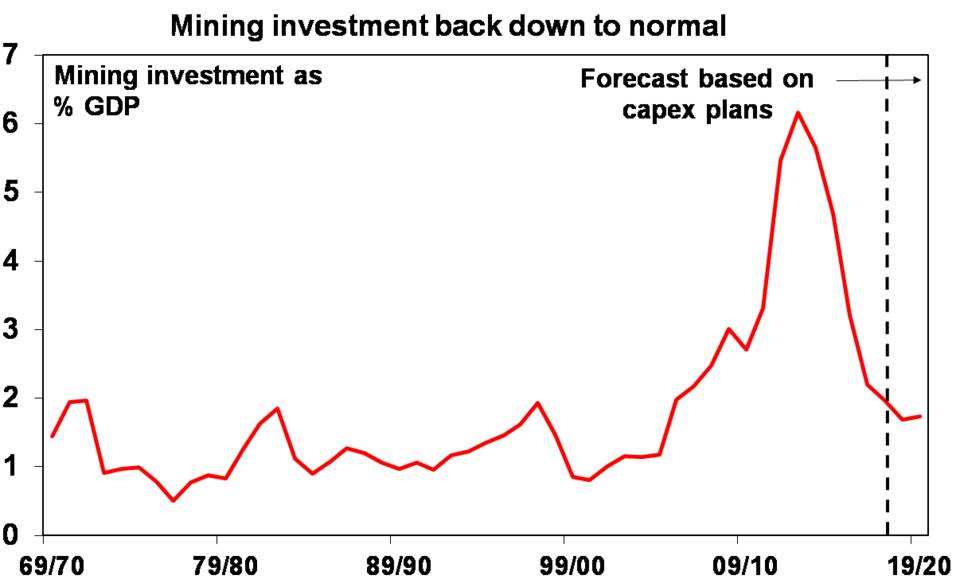
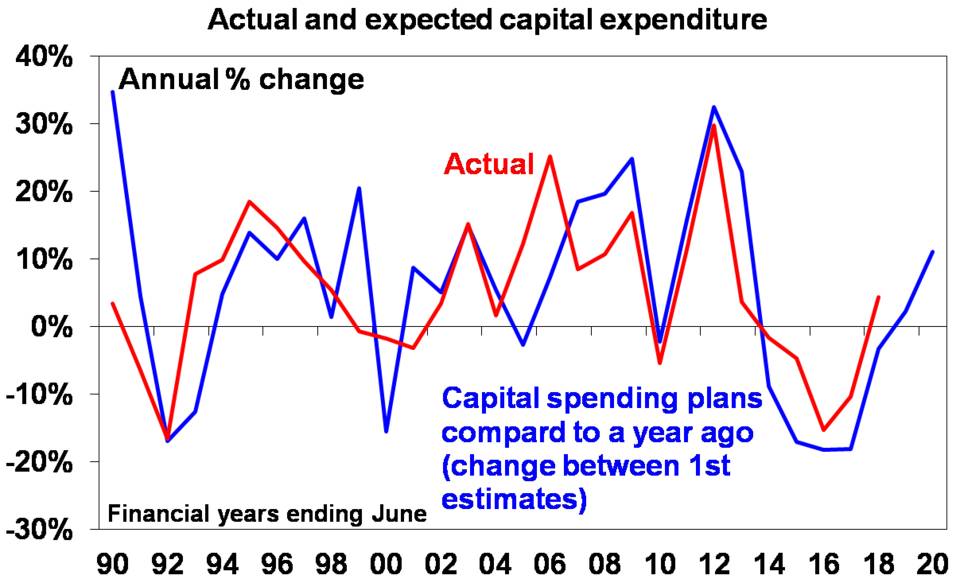
Surveys of business conditions showed a positive trend for much of 2018, although they eased towards the end of the year. Encouraging signs emerged for capital spending by the non-mining sector, with 6% growth over the year suggesting the corporate sector is finally starting to increase investment. After years of lower investment spending by the mining sector, the RBA stated in October that mining investment should grow later in 2019 as companies need to invest to sustain production. Public investment spending remained at high levels, with work continuing on a number of large infrastructure projects around the nation.

The Australian dollar weakened over the year, which benefited Australian exports. The Australian dollar fell 10% against the US dollar and was down 5.5% and 12.3% against the euro and yen respectively.

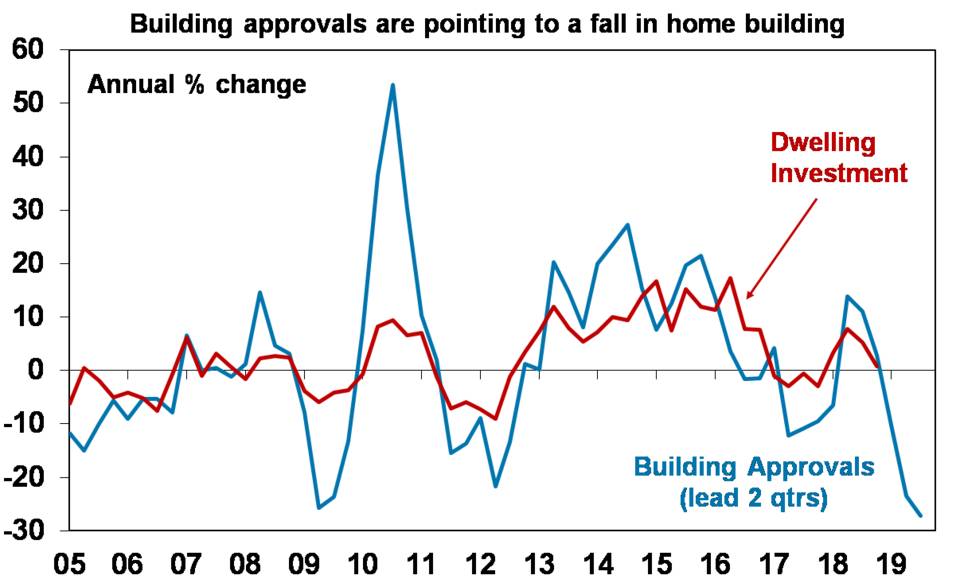
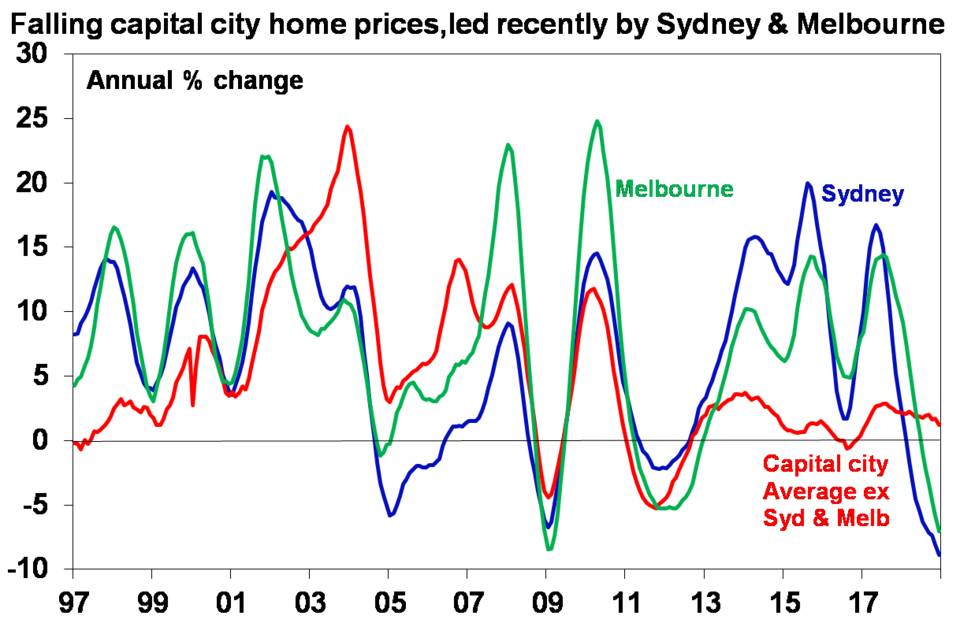
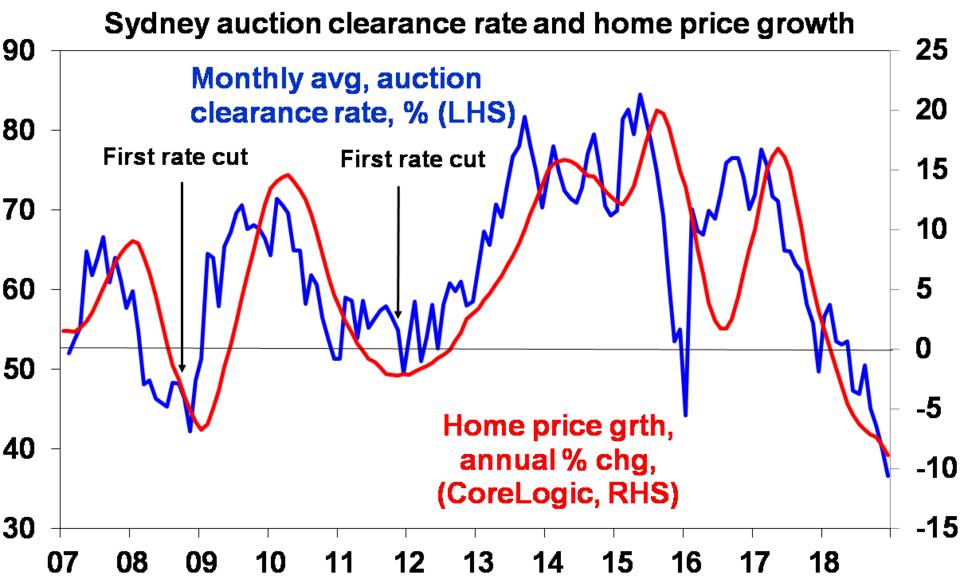
After years of strong price rises, Australian house prices fell 6% over the year, with steeper falls of 9% and 7% in the Sydney and Melbourne markets respectively. Australia’s housing market has been impacted by some banks raising mortgage interest rates and imposing more stringent lending standards, particularly for investors. Investor credit has slowed substantially and is barely growing.

Bond markets were also volatile during the year

Volatility returned to bond markets in 2018, with gradual tightening of monetary policy and withdrawal of central bank support having a wide ranging impact. With strong US economic performance continuing, the Fed kept to their forecast of four 0.25% rate rises through the year, although there are signs that they are considering a pause in the hiking cycle early in 2019. US 10-year yields rose sharply at the beginning of the year as bond prices fell. Yields eventually reached a high of 3.2% in October before falling back below 3% by year end as economic data started to weaken. Bond markets in Europe were dominated by chaotic political developments, with the ongoing Brexit debacle and a new populist Italian government worrying investors. European growth was below expectations and investors’ risk aversion meant German yields remained very low despite the closure of the ECB bond purchasing program in December.

With the US government increasing interest rates and reducing its debt, US dollar liquidity has tightened, negatively affecting bond markets this year. Investment grade and emerging markets’ bonds were the first to be affected. Although high yield bonds were fairly resilient for much of the year, they too suffered a sharp fall in their values in the last quarter as risk aversion grew. The last few years have seen rapid growth in corporate borrowing and a corresponding decline in lending standards, but until early 2018 the strong investor demand for additional yield meant the value of high credit risk bonds remained elevated. Now that even low risk bonds (eg US Treasuries) are delivering materially positive yields, investors don’t need to invest in higher credit risk bonds to get a decent yield, resulting in a shift in the supply-demand balance. In addition, increased concerns about trade wars and a potential recession in the next few years have driven a repricing of credit risk. Emerging markets endured a torrid year, with the strong US dollar putting pressure on several countries reliant on external financing.

In Australia, the RBA kept rates on hold, as reasonable economic growth was being offset by a weakening housing market. Local credit markets were largely insulated from the global sell-off.

In terms of index performance, global bonds delivered low single digit returns, with investment grade bonds slightly negative over the year in Australian dollar (hedged) terms. Local bonds outperformed global as Australian yields and spreads remained relatively stable. Bank loans significantly outperformed other high yield assets as their floating rate structure protected them from the impact of US interest rate rises, resulting in low single digit returns for the year.

In uncertain markets, a defensive portfolio stance remains justified

MLC has believed for some time that the appropriate response to the challenging investment environment is to defensively position our multi-asset portfolios − the MLC Inflation Plus, MLC Horizon and MLC Index Plus portfolios. Decisions we’ve made include:

  • holding more cash than normal
  • remaining highly selective about the types of bonds we invest in to limit exposure to securities that will fall in value if interest rates rise quickly
  • retaining a high exposure to unhedged global shares to increase diversification
  • employing innovative currency and option protection strategies to improve risk control, and
  • including non-benchmark aware strategies that provide returns that are not reliant on share markets and help preserve investors’ capital in weak and volatile markets.

In the MLC Inflation Plus portfolios we’ve also employed defensive strategies such as our Defensive Australian Shares Strategy. This unique strategy has helped reduce the impact of risks specific to the Australian market, such as the high exposure to banks.

While our focus on managing risk in our multi-asset portfolios may not prevent negative returns in weak share market conditions, it should provide some insulation for investors.

How does MLC’s investment process deal with an uncertain outlook?

At MLC, we focus strongly on risk management. We believe managing risk for our investors is the sustainable way of generating returns for them – and in this unpredictable investment environment, it’s more critical than ever.

As a result, we design and manage our multi-asset portfolios to be resilient in a wide range of possible market conditions. Using our market-leading investment approach, we constantly assess how our multi-asset portfolios are likely to perform in many potential market scenarios, both good and bad. We can then adjust our portfolios to manage possible risks and take advantage of potential return opportunities.

This careful analysis means our portfolios are widely diversified, risk-aware and positioned for many market environments.

SOURCE: https://www.mlc.com.au/personal/blog/2019/01/the_2018_year_inrev

Page 6 of 13«‹45678›»

Like to know more…

Enter your details and we will contact you with in 24 hours

    Want to learn more?

    Come in for a chat!

    Get in touch for your FREE no-obligation consultation. Appointments available during business hours or after hours by appointment.

    Get In Touch

    Financial Advice Services

    Pre-retirement and Retirement Planning

    Centrelink Maximisation Strategies

    Superannuation Fund and Strategy Advice

    Self Managed Superannuation Funds

    Personal Risk Insurance

    Wealth Accumulation

    Tax Minimisation and Tax Planning

    Debt Management

    Lifestyle Expense Planning

    Estate Planning

    Useful Links

    Meet the Team

    Our Advice process

    Fees & Charges

    Blogs

    Financial Calculators

    Financial Services Guide

    Privacy Policy

    Terms & Conditions

    General Advice Warning

    Opening Hours

    Appointments available outside these times by prior arrangement.

    Monday 9am - 5pm
    Tuesday 9am - 5pm
    Wednesday 9am - 5pm
    Thursday 9am - 5pm
    Friday 9am - 4pm
    Saturday Closed
    Sunday Closed

    Our Office

    11 Lawrence St, North Ipswich QLD 4305

    Contact Us

    Phone: (07) 3281 1226
    Email: twm@totalwealth.com.au
    Fax: (07) 3282 9900

    Postal address

    PO Box 2648, North Ipswich QLD 4305

    Enquire online

    LFG Financial Services
    Total Wealth Management is an authorised representative of LFG Financial Services
    © Copyright Total Wealth Management Pty Ltd ALL RIGHTS RESERVED. | Design by SG to 'By Digilari'
    • Financial Services Guide
    • Complaints Policy
    • Privacy Policy
    • Terms & Conditions
    • General Advice Warning
    Scroll to top