Total Wealth Management
CALL NOW (07) 3281 1226
  • Our Team
  • Services
    • Retirement Planning
    • Centrelink Maximisation Strategies
    • Retirement & Superannuation Planning
    • Personal Insurance Advisers
    • Tax Planning & Strategies
    • Debt Recycling
    • Lifestyle Expense Planning
    • Wills & Estate Planning
  • Process
  • Contact
  • Facebook
Phone: (07) 3281 1226
Total Wealth Management
  • Home
  • About
    • Meet the Team
    • Testimonial
    • Our Advice Process
    • Fees & Charges
  • Services
    • Investing
      • Wealth Accumulation & Management
    • Insurance
      • Personal Insurance Advice
    • Tax Planning & Strategies
    • Loan & Debt Reduction
    • Retirement
      • Retirement Planning
      • Superannuation Advice
      • Centrelink Financial Advice
      • Wills & Estate Planning
      • Lifestyle Expense Planning
  • Knowledge Centre
    • Blog
    • Life Stages
      • Young Independents
      • Retirement Planning
      • Young Families
      • Mature Families
      • Pre-Retirees
      • Retirees
      • Twilight Years
    • FAQ
    • General Finance Calculators
    • Useful Links
    • Free Reports
  • Contact Us
  • Search
Total Wealth Management > Archived

13 common sense tips to help manage your finances

November 22, 2018/0 Comments/in Archived /by Digilari

Key points

  • Getting your personal finances right can be a challenge. Here are 13 tips that may be of use: shop around when it comes to financial services; don’t take on too much debt; allow that interest rates can go up as well as down; allow for rainy days; credit cards are great but they deserve respect; use your mortgage (if you can) for all longer term debt; start saving and investing early; allow that asset prices go up and down; try and see financial events in their longer-term context; know your risk tolerance; make the most of the Mum and Dad bank; be wary of the crowd; and there is no free lunch.

Introduction

A few months ago Reserve Bank Governor Phillip Lowe provided four common sense points we should all keep in mind regarding borrowing to finance a home. (The Governor’s speech can be found here). I thought they made sense and so summarised them in a tweet to which someone replied that every checkout operator knows them. Which got me thinking that maybe many do know them, but a lot don’t, otherwise Australians would never have trouble with their finances. So I thought it would be useful to expand Governor Lowe’s list to cover broader financing and investment decisions we make. I have deliberately kept it simple and in many cases this draws on personal experience. I won’t tell you to have a budget though because that’s like telling you to suck eggs.

1. Shop around

We often shop around to get the best deal when it comes to consumer items but the same should apply to financial services. As Governor Lowe points out “don’t be shy to ask for a better deal whether for your mortgage, your electricity contract or your phone plan”. The same applies to your insurance, banking, superannuation, etc. It’s a highly-competitive world out there and financial companies want to get and keep your business. So when getting a new financial service it makes sense to look around. And when it comes time to renew a service – say your home and contents insurance – and you find that the annual charge has gone up way in excess of inflation (which is currently around 2%) it makes sense to call your provider to ask what gives. I have often done this to then be offered a better deal on the grounds that I am a long-term loyal customer.

2. Don’t take on too much debt

Debt is great, up too a point. It helps you have today what you would otherwise have to wait till tomorrow for. It enables you to spread the costs associated with long term “assets” like a home over the years you get the benefit of it and it enables you to enhance your underlying investment returns. But as with everything you can have too much of it. Someone wise once said “it’s not what you own that will send you bust but what you owe.” So always make sure that you don’t take on so much debt that it may force you to sell all your investments just at the time you should be adding to them or worse still potentially send you bust. Or to sell your house when it has fallen in value. A rough guide may be that when debt servicing costs exceed 30% of your income then maybe you have too much debt – but it depends on your income and expenses. A higher income person could manage a higher debt servicing to income ratio simply because living expenses take up less of their income.

3. Allow that interest rates can go up as well as down

Yeah, I know that it’s a long time since offical interest rates were last raised in Australia – in fact it was way back in 2010. So as Governor Lowe observes “many borrowers have never experienced a rise in official interest rates”. But don’t be fooled by the recent history of falling or low rates. My view is that an increase in rates is still a long way off (and they may even fall further first) – but that’s just a view and views can be wrong. History tells us that eventually the interest rate cycle will turn up. Just look at the US where after six years of near zero interest rates, official US interest rates have risen 2% over the last three years. So, the key is to make sure you can afford higher interest payments at some point. And when official rates move up the moves tend to be a lot larger than the small out of cycle moves from banks that have caused much angst lately.

4. Allow for rainy days

This is another one raised by Governor Lowe who said: “things don’t always turn out as we expect. So for most of us having a buffer against the unexpected makes a lot of sense.” The rainy day could come as a result of higher interest rates, job loss or an unexpected expense. This basically means not taking all the debt offered to you, trying to stay ahead of your payments and making sure that when you draw down your loan you can withstand at least a 2% rise in interest rates.

5. Credit cards are great, but they deserve respect

I love my credit cards. They provide me with free credit for up to around 6-7 weeks and they attract points that can really mount up (just convert the points into gift cards and they make optimal Christmas presents!). So, it makes sense to put as much of my expenses as I can on them. But they charge usurious interest rates of around 20-21% if I get a cash advance or don’t pay the full balance by the due date. So never get a cash advance unless it’s an absolute emergency and always pay by the due date. Sure the 20-21% rate sounds a rip-off but don’t forget that credit card debt is not secured by your house and at least the high rate provides that extra incentive to pay by the due date.

6. Use your mortgage for longer term debt

Credit cards are not for long term debt, but your mortgage is. And partly because it’s secured by your house, mortgage rates are low compared to other borrowing rates – at around 4-5% for most. So if you have any debt that may take longer than the due date on your credit card to pay off then it should be on your mortgage if you have one.

7. Start saving and investing early

If you want to build your wealth to get a deposit for a house or save for retirement the best way to do that is to take advantage of compound interest – where returns build on returns. Obviously, this works best with assets that provide high returns on average over long periods. But to make the most of it you have to start as early as possible. Which is why those piggy banks that banks periodically hand out to children have such merit in getting us into the habit of saving early.

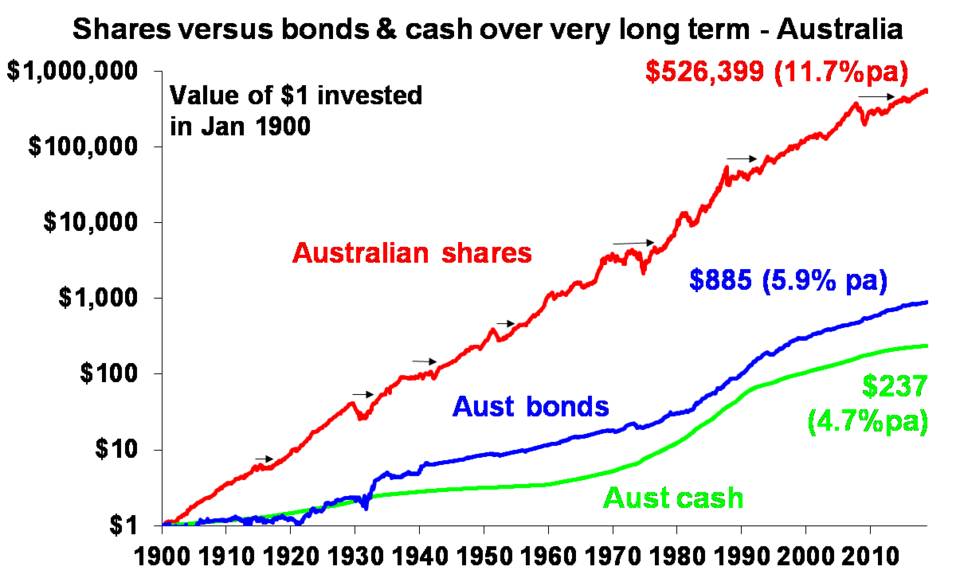
Of course, this gives me an opportunity to again show my favourite chart on investing which tracks the value of $1 invested in Australian shares, bonds and cash since 1900 with dividends and interest reinvested along the way. Cash is safe but has low returns and that $1 will have only grown to $237 today. Shares are volatile (& so have rough periods highlighted by arrows) but if you can look through that they will grow your wealth and that $1 will have grown to $526,399 by today.

Source: Global Financial Data, AMP Capital

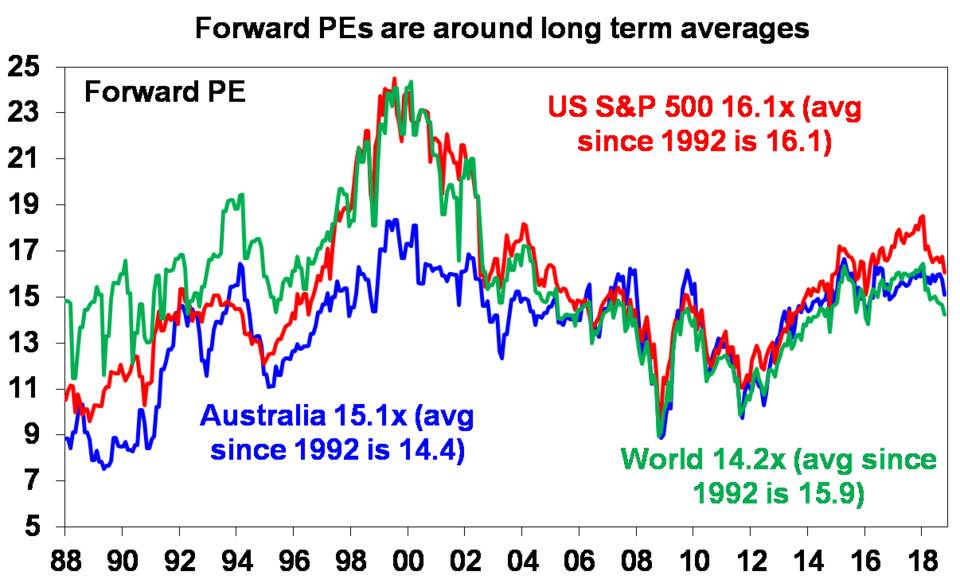
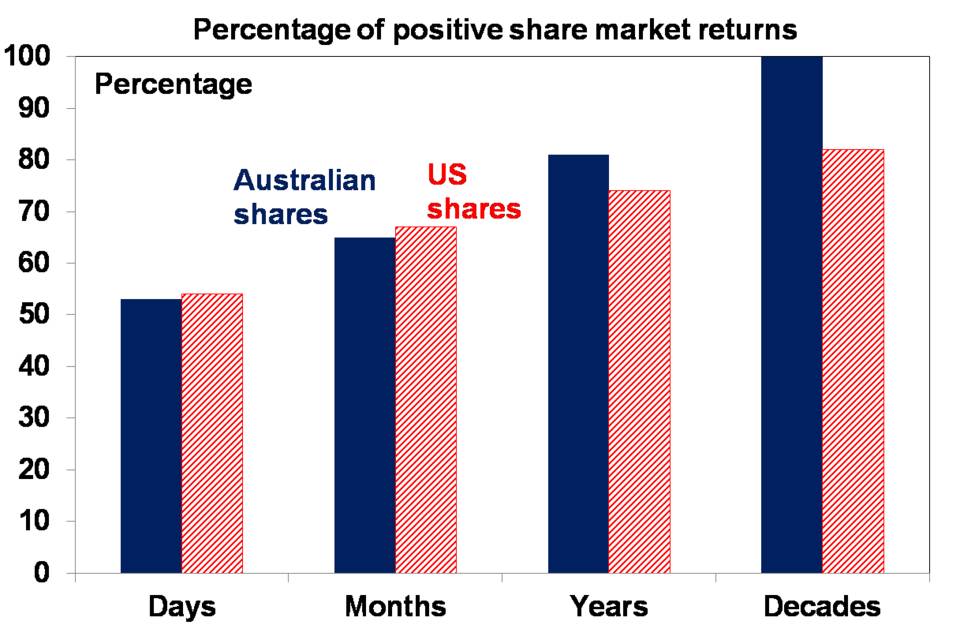
8. Allow that asset prices go up and down

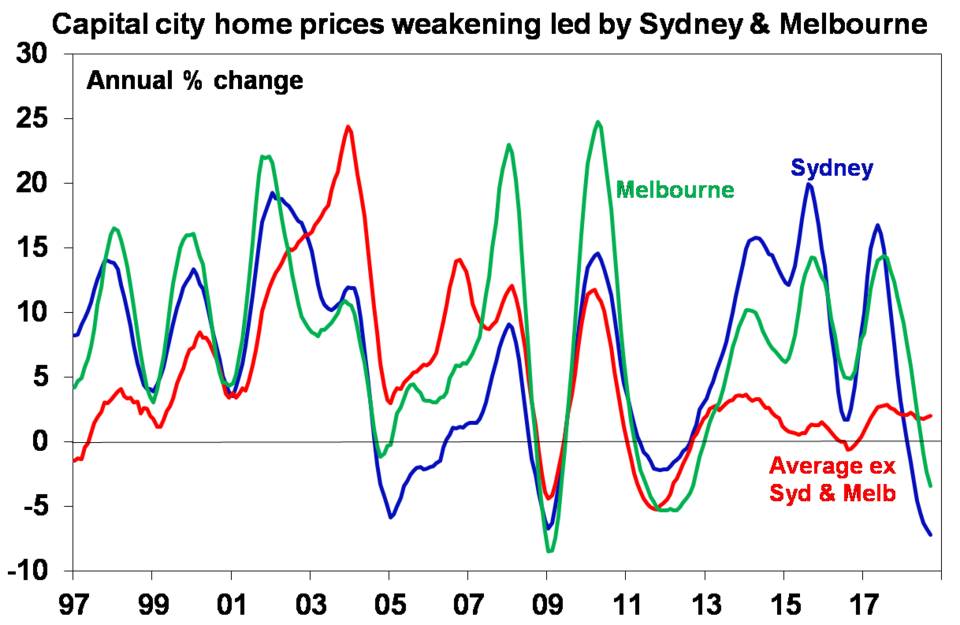
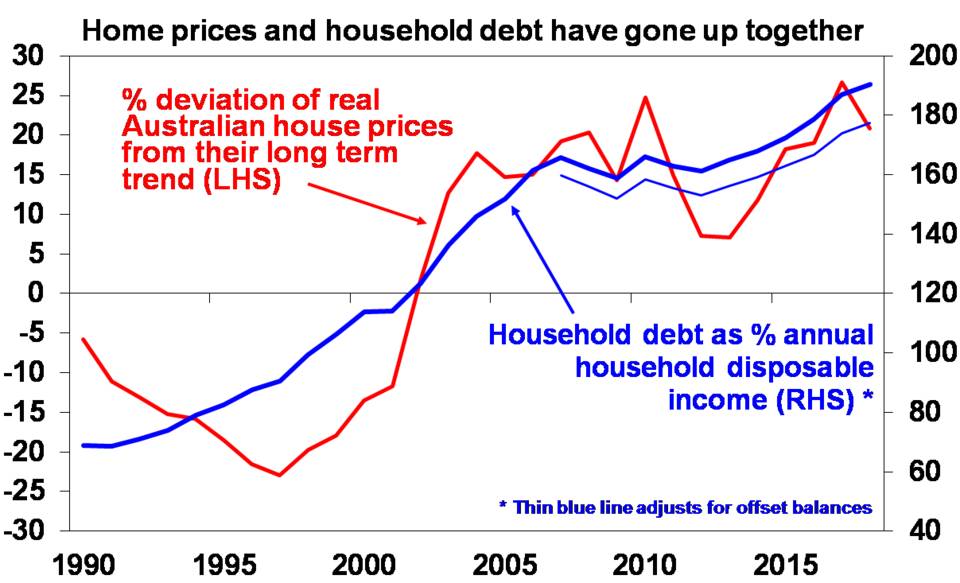
It’s well known that the share market goes through rough patches. The volatility seen in the share market is the price we pay for higher returns than most other asset classes over the long term. But when it comes to property there seems to be an urban myth that it never goes down in value. Of course property prices will always be smoother than share prices because it’s not traded daily and so is not subject to daily swings in sentiment. But history tells home prices do go down as well as up. Japanese property prices fell for almost two decades after the 1980s bubble years, US and some European countries’ property values fell sharply in the GFC and the Australian residential property market has seen several episodes of falls over the years and of course we are going through one right now. So the key is to allow that asset prices don’t always go up – even when the population and the economy are growing.

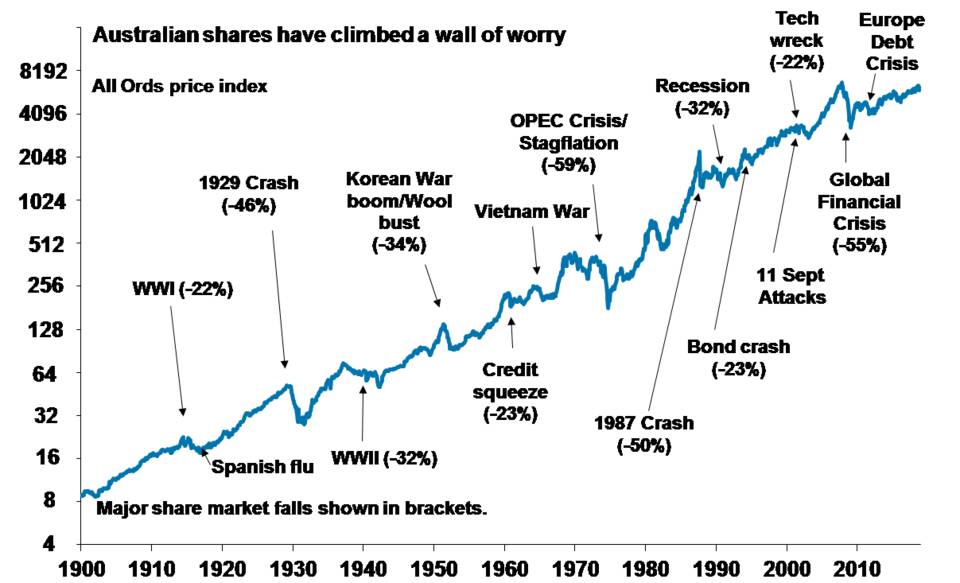
9. Try and see big financial events in their long-term context

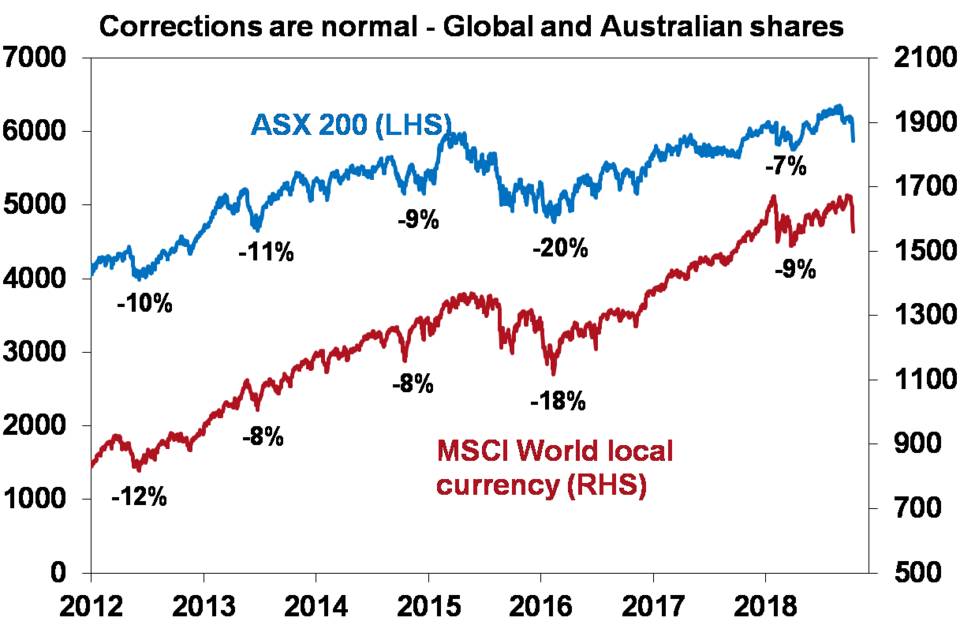
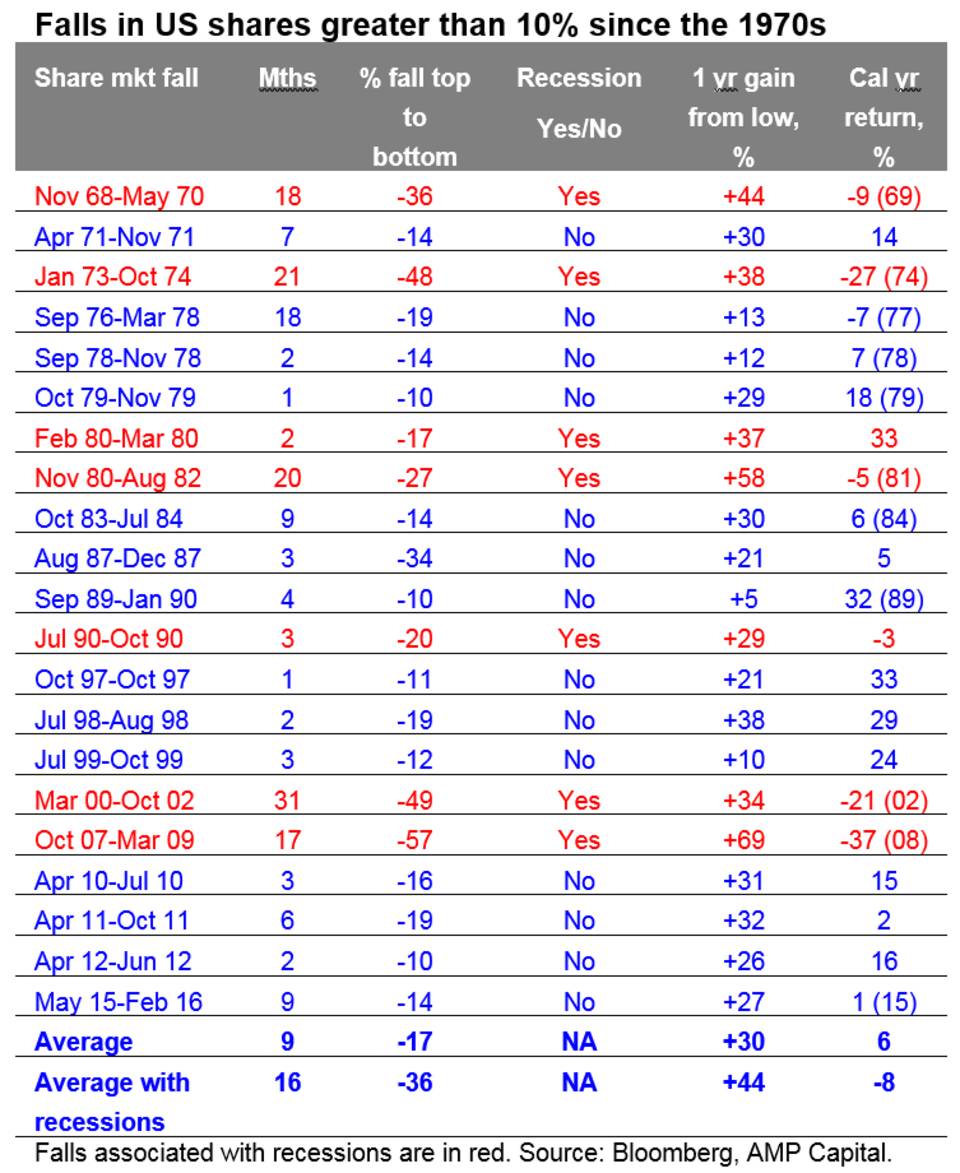
Hearing that $50bn was wiped off the share market in one day sounda scary – but it tells you little about how much the market actually fell and you have only lost something if you actually sell out after the fall. Scarier was the roughly 20% fall in share markets through 2015-16 and worse still the GFC that saw roughly 50% falls. But such events happen every so often in share markets – the 1987 crash saw a 50% in a few months & Australian shares fell 59% over 1973-74. And after each the market has gone back up. So, we have seen it all before even though the details may differ. The trick is to allow for periodic sharp falls in your investment strategy and when they do happen remind yourself that we have seen it all before and the market will find a base and resume its long-term rising trend.

10. Know your risk tolerance

When embarking on investing it’s worth thinking about how you might respond if you found out that market movements had just wiped 20% off the value of your investments. If your response is likely to be: “I don’t like it, but this sometimes happens in markets and history tells me that if I stick to my strategy I will see a recovery in time” then no problem. But if your response might be: “I can’t sleep at night because of this, get me out of here” then maybe you should rethink your strategy as you will just end up selling at market bottoms and buying tops. So try and match your investment strategy to your risk tolerance.

11. Make the most of the Mum and Dad bank

The housing boom in Australia that got underway in the mid-1990s and reached fever pitch in Sydney & Melbourne last year has left housing very unaffordable for many. This contributed to a huge wealth transfer from Millennials to Baby Boomers and some Gen Xers. Hopefully the current home price correction underway will help in starting to correct that. But for Millennials in the meantime, if you can it makes sense to make the most of the “Mum and Dad bank”. There are two ways to do this. First stay at home with Mum and Dad as long as you can and use the cheap rent to get a foot hold in the property market via a property investment and then using the benefits of being able to deduct interest costs from your income to reduce your tax bill to pay down your debt as quickly as you can so that you may be able to ultimately buy something you really want. (Of course, changes to negative gearing if there is a change to a Labor Government could affect this.) Second consider leaning on your parents for help with a deposit. Just don’t tell my kids this!

12. Be wary of what you hear at parties

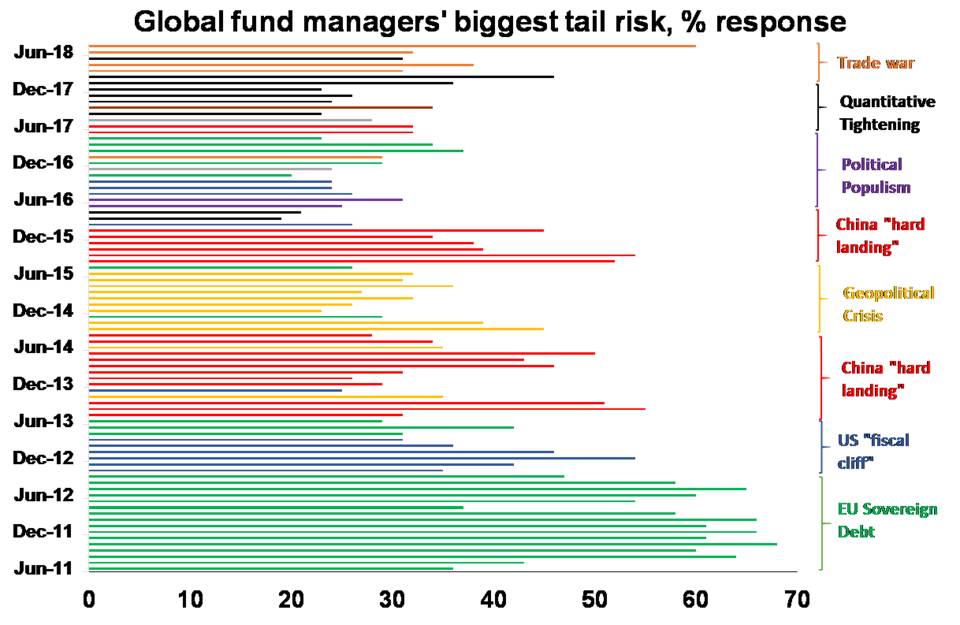
A year ago Bitcoin was all the rage. Even my dog was asking about it – but piling in at around $US19,000 a coin just when everyone was talking about it back then would not have been wise (its now below $US6500) even though many saw it as the best thing since sliced bread. Often when the crowd is dead set on some investment it’s best to do the opposite.

13. There is no free lunch

When it comes to borrowing & investing there is no free lunch – if something looks too good to be true (whether it’s ultra-low fees or interest rates or investment products claiming ultra-high returns & low risk) then it probably is and it’s best to stay away.

Concluding comment

I have focussed here mainly on personal finance and investing at a very high level, as opposed to drilling into things like diversification and taking a long-term view to your investments. An earlier note entitled “Nine keys to successful investing” focussed in more detail on investing and can be found here.

SOURCE: https://www.ampcapital.com/au/en/insights-hub/articles/2018/November/13-common-sense-tips-to-help-manage-your-finances

Rising US interest rates, trade wars, the US midterm election results, etc – should investors be worried?

November 12, 2018/0 Comments/in Archived /by Digilari

Key points

  • It’s still too early to be sure that last month’s pullback in shares is over but we remain of the view that it was not the start of a deep bear market and that the trend in shares remains up
  • Worries around US interest rates, trade wars, European politics etc are unlikely to be terminal.
  • The US midterm election turned out pretty much as polls indicated. Since 1946 US shares have rallied in the 12 months after all midterm elections.

Introduction
October was a bad month for shares with global shares losing 6.8% in local currency terms and Australian shares losing 6.1%. It’s possible that following top to bottom falls of 9% for global shares, 11% for Australian shares, 21% in emerging markets and 31% in Chinese shares we have now seen the low in the share market rout. Shares were due a bounce and from their October lows and Australian shares have risen around 4% since. But it’s impossible to be definitive and with the worry list around US interest rates, trade, politics, etc, there could still be another leg down. However, our view remains that recent turbulence in share markets is a correction or a mild bear market at worst (like 2015-16) rather than the start of a deep bear market like the global financial crisis. This note reviews the key recent worries for shares and why they are unlikely to be terminal.

US inflation & interest rates

The US economy is very strong as evidenced by consumer confidence at an 18-year high, unemployment at a 49-year low and strong economic growth. With spare capacity being used up wages growth is edging higher as shown in the next chart.

Source: Bloomberg, AMP Capital

Against this backdrop it makes sense for the Fed to continue the process of returning monetary policy and interest rates to something more normal. Naturally, the ongoing removal of monetary stimulus in the US creates consternation and has been periodically occurring ever since former Fed Chair Bernanke started talking about slowing or “tapering” quantitative easing in 2013. In short, investors continue to fear a return to the GFC and so any move to remove monetary support creates periodic bouts of fear. Several points are worth noting about this though. First, the Fed can afford to remain gradual in raising rates. Inflation is at the 2% target, wages growth is a long way from the 4% plus level that preceded past recessions and productivity growth is rising so this will keep growth in unit labour costs down. Meanwhile, intense competition and technological innovation are also continuing to help keep inflation constrained.

Second, on any measure US monetary policy is a long way from being tight. The Fed Funds rate is zero in real terms, it’s well below nominal growth and the yield curve is still positive.

Finally, a return to more normal interest rates is a good thing because it reflects a stronger, more normal economy.

In short, expect gradual 0.25% Fed rate hikes to continue, with the next hike coming in December, and this will cause bouts of market volatility but it’s a long way from crunching the economy in a way that would bring on a deep bear market in shares.

The US/China trade conflict

This issue has been periodically worrying markets since around March. It stepped up a notch after last month’s speech by US Vice President Mike Pence indicating that US gripes with China extend beyond trade which led many to talk of a new Cold War – the implication of which is less trade and occasional military tensions which implies lower economic growth and lower price to earnings multiples. However, it’s still not as bad as it looks.

First, so far only 12% of US imports have been subject to a tariff hike averaging 15%, which is equivalent to an average tariff hike of 1.8% across all imports. So it’s a non-event compared to 1930 which saw a 20% tariff hike on all imports.

Second, while initially the US seemed to be picking trade fights with all major countries it has since renegotiated trade agreements with South Korea and Canada/Mexico and is negotiating with Europe and Japan. This tells us Trump is not interested in trade wars with everyone and that he is not anti-trade per se but wants “fairer trade” for the US.

Third, while Trump has threatened more tariff hikes on China if it retaliates it’s noteworthy that China has not fully retaliated and has been cutting tariffs and announcing more protections for intellectual property. This may help defuse the tensions a bit.

Fourth, while Trump’s comments expressing optimism about a deal with China should be treated with scepticism as they came just before the US midterm elections, they do highlight cause for optimism that a deal will be reached eventually. At least Trump and Xi are talking and Trump’s optimistic comments ahead of the midterms effectively tells us that he is aware that the trade issue is harming the stock market and potentially the economy. The latter in turn suggests that he wants a deal well before he faces re-election in 2020. So, while it may be premature to expect a deal when Xi and Trump meet later this month, a deal is likely well ahead of the 2020 elections. With China already lowering tariffs, improving intellectual property protections and softening joint venture requirements the outlines of a deal are starting to become apparent and Chinese Vice President Wang has indicated China is ready to negotiate with the US.

The US midterm elections – no surprises

The US midterm elections saw the Democrats win control of the House and Republicans retain the Senate which was what had been indicated by the polls and betting markets. So, it provided no surprises – in contrast to Brexit and Trump’s 2016 win! While the Democrat House is likely to prevent Trump from cutting taxes any further it won’t be able wind back last year’s tax cuts, reverse Trump’s deregulation of the economy or change his trade policy. But there is some chance that Trump and the Democrats may agree on infrastructure spending. While the Democrat House will likely set up committees to investigate Trump and consider impeachment charges, it’s very unlikely to get the required 67 out of 100 senate votes to remove him from office unless he is shown to have done something really bad. All up, while there may be some skirmishes around shutdowns and debt ceilings, the midterm outcome could be positive because it means less policy uncertainty.

On average, US Presidents have lost 29 House seats in their first midterm election. Clinton lost 54 and Obama lost 63. Trump looks to have lost around 34 but only needed to lose 23 to lose control of the House so what has happened is not unusual. What’s more the Republicans look to have increased their Senate majority so it’s not all bad for Trump. More broadly, it should be noted that “divided government” is the norm in the US. Perhaps the biggest risk is that Trump takes it personally and ramps up the populism, but if he wants to get re-elected in 2020 (which he does) then he won’t want to do anything that damages the economy and amongst other things this points to cutting a deal with China and getting the tariffs removed. Since 1946 the US S&P 500 has risen in the 12 months after all midterm elections – probably because the president starts to focus on re-election and so tries to boost the economy.

Source: Bloomberg, AMP Capital

US tech stocks
Having accounted for a big chunk of US share market gains this year the US tech sector has corrected around 13%, but that still leaves it vulnerable to relatively high valuations (Nasdaq is on a PE of 42 times), sales growth slowing down for some of them and the prospect of increasing regulation. However, we have not seen anything like the tech boom euphoria of around 1999/2000 so a crash like back then is unlikely. Our base case is that the US share market will start to see a rotation from expensive tech to cheap cyclical stocks (with many trading on forward PE’s of less than ten times).

Eurozone worries – German and Italy

Fears that the Eurozone is about to blow apart causing financial mayhem and threatening global growth have been with us since the Eurozone crisis that started in 2010. Lately the fear is that populist governments will take countries out of the Euro. This started with Greece in 2015. It was an issue last year but then pro-Euro parties and candidates won in various elections. This year it’s been an issue with Italy particularly, as its populist government sought a wider budget deficit, and Germany with Angela Merkel indicating she will step down as Chancellor in 2021. In terms of Italy, there will no doubt be a conflict between the European Commission and Italy over the size of its planned budget deficit but don’t expect it to go too far as the deficit is not outlandish and German and France won’t want to embolden the Eurosceptics in Italy by pushing back too hard.

In terms of Germany, the poor performances of the governing German grand coalition parties the Christian Democratic Union (CDU), the Christian Social Union and the Social Democrat Party (SPD) at state elections do not signal a threat to the Euro. First, comments by SPD leader Nahles indicate the grand coalition is not under imminent threat. Second, Germany’s budget surplus and falling public debt indicate plenty of scope to provide fiscal stimulus, which would be positive for Germany and the Eurozone and provide an electoral boost for the grand coalition partners. Thirdly, German Euroscepticism is not on the rise. In fact, support for the Euro in Germany has risen to 83% and it was support for the pro-Euro Greens that surprised in Bavaria and Hesse, not support for the Alternative for Deutschland. Finally, a new election is unlikely as both the CDU and SPD have seen a loss of support, so they aren’t going to back an early election. So those looking for a breakup of the Euro can keep looking.

Oil prices – back down again

In early October world oil prices reached their highest since 2014 with West Texas Intermediate topping $US76/barrel with talk it was on its way to $US100 on the back of strong demand and supply threats including impending US sanctions on Iran. This in turn was adding to concerns about the impact on global economic growth and rising inflation. However, since then the oil price has fallen by nearly 19%. US sanctions on Iran have started but with little new impact as Iranian oil exports had already fallen and the US granted waivers to allow eight countries – including Japan, China, India, Taiwan and South Korea – to continuing importing Iranian oil. The Iranian export cutbacks at a time of threats to production from Venezuela and Libya leaves a now-tight global oil market at risk of higher prices, but for now the threat has receded a bit.

SOURCE: https://www.ampcapital.com/au/en/insights-hub/articles/2018/November/Rising-US-interest-rates-trade-wards-the-US-midterm-election-results-etc-should-investors-be-worried

Newsletter – 2nd Nov 2018

November 2, 2018/0 Comments/in Archived, News /by Digilari

Dear Sir/Madam,

After being away at a conference in South Australia, Rod is back on deck and the office is busy again leading up to Christmas which is less than 8 weeks away!

We have decided that each month we will try to include a story regarding one of our clients. If you have a story or photos to share, please get in touch and we will include them in future newsletters.

This month, Rod would like to give you an insight into the work life of one of our clients, Evan who is a truck driver for a local company. Every Sunday morning, Evan loads fertiliser from the Brisbane port and drives to Townsville where he unloads this on Monday. He is then in Winton by Tuesday to pick up a load of gypsum and back in Ipswich by Wednesday. All up his total journey is approximately 4,300kms. Evan tells us that the gross weight of truck and trailers fully loaded is 101 tonne. This is Evan’s truck below:

Recently, someone we know has had a melanoma removed. This is our reminder for everyone that with the summer season upon us, to make sure you slip, slop, slap and to get your regular skin check.

For all our Colonial First State clients, we have been advised that they are in the process of converting to online statements. This will affect a few of our clients over the next few months. As with our MLC clients, if you prefer not to have to login, you are welcome to contact us and we can provide these statements to you by email.

Until next month,

Emma

Are shares expensive?

October 29, 2018/0 Comments/in Archived /by Digilari

Key points

  • Starting point valuations for shares matter a lot in terms of medium-term return potential and vulnerability to share market falls. Basically, the cheaper the better.
  • Developed market shares are not dirt cheap (and haven’t been for several years) but on most measures they are not at overvalued extremes. US shares are most at risk, but other markets are reasonable.

Introduction

Some commentators claim shares are way overvalued and so a crash is inevitable. As always, it’s a lot more complicated, but given the current turbulence in share markets it’s worth having a look at whether share markets are expensive or not as a guide to how vulnerable we are to further falls. More broadly, valuation measures provide a guide to future return potential.

Why valuation matters – the cheaper the better

First a bit of background on valuation. A valuation measure for an asset is basically a guide to whether it’s expensive or cheap compared to the income it generates. Simple valuation measures are price to earnings ratios (PEs) for shares (the lower the better) and yields, ie the ratio of dividends, rents or interest payments to the value of the asset (the higher the better). An obvious example of where the starting point valuation matters critically is cash. For some years now, bank term deposit rates have been historically low meaning returns are low and value is poor.

For government bonds the yield is similarly a good guide to value. Over the medium term the main driver of the return a bond investor will get is what bond yields were when they invested. While the relationship is not perfect, it can be seen in the next chart – which shows a scatter plot of Australian 10-year bond yields (horizontal axis) against subsequent 10-year returns from Australian bonds based on the Composite All Maturities Bond index (vertical axis) – that the higher the bond yield, the higher the subsequent 10-year return from bonds.

Source: Global Financial Data, Bloomberg, AMP Capital

Again, despite rising a bit in the last two years, bond yields remain low so low returns should be expected from bonds.

For shares a similar relationship holds. The following chart shows a scatter plot of the PE ratio for US shares since 1900 (horizontal axis) against subsequent 10-year total returns (ie dividends and capital growth) from shares. While it is not as smooth as with bonds as there is more involved in shares, it indicates a negative relationship, ie when share prices are relatively high compared to earnings subsequent returns tend to be relatively low.

Source: Global Financial Data, Bloomberg, AMP Capital

The next chart shows the same for Australian shares. Again, there is the expected negative relationship between the level of the PE and subsequent total returns (based on the All Ords Accumulation index).

Source: RBA, Global Financial Data, AMP Capital

The key is that the starting point valuation matters. The higher the yield (or the lower the PE) the better.

Complications to be aware of

Of course, there are several pitfalls with valuation measures that investors should be aware of:

  • Sometimes assets are cheap for a reason (value traps). This is more often associated with individual shares, eg, a tobacco company subject to an impending law suit. These traps can really only be picked up by thorough research.
  • Valuation measures are a poor guide to timing. Eg, if an investor sold shares short in 1996 when Fed Chair Greenspan warned of “irrational exuberance” they would have lost out as shares rose for another four years. Australian residential property has been overvalued for almost 15 years but that’s been no guide to timing a fall in home prices. The key is to have a thorough investment process that depends on more than just valuations.
  • There is a huge range of share market valuation measures. For example, the “earnings” in the PE calculation can be earnings reported over the last 12 months, consensus earnings expectations for the year ahead or earnings that have been smoothed to remove cyclical distortions. All have their pros and cons. For example, the historic PE is based on actual data with no forecasting, but it can give the wrong signal during a recession as earnings may collapse more than share prices and so the PE may not give a buy signal.
  • Finally, the appropriate level of valuation can vary depending on the environment. For example, in a period of low inflation and low interest rates it’s well-known that assets can trade on lower yields as the interest rate/yield structure in the economy falls. This in turn means higher PEs. So low inflation, say down to around 2%, can be good for shares via higher PEs. But if inflation goes from “low” to deflation it can be bad as it tends to be associated with poor growth and so shares trade on lower PEs.

The message from all this is that share market valuation is important, but you ideally need to assess it along with other indicators if you are trying to time market moves. The key is to acknowledge that when a range of valuations measures are at an extreme then they are probably providing a signal that should not be ignored.

So what are current share market valuations signalling?

Let’s start with price to earnings ratios using historic earnings, ie, earnings reported for the last 12 months. In the US, this PE is currently around 21 times which is consistent with subdued medium-term returns going by the second scatter plot on the previous page. But in Australia at around 15.3 times it’s consistent with reasonable medium term returns according to the third scatter plot on the previous page. Of course, current levels for historic PEs in the US and Australia have both been associated with a very wide range in terms of subsequent returns historically. Furthermore, PEs based on historic earnings are not totally reliable given the cyclical volatility in reported earnings.

Given this, calculating the price to earnings ratio using 12 month ahead projected earnings are arguably more useful. These are shown in the next chart for global shares, the US and Australia. None are way out of line with their averages since the early 1990s but in a relative sense US shares on a forward PE of 16.1 times remain a bit expensive albeit less so than earlier this year, and global shares are a bit cheap trading on a forward PE of 14.2 times thanks to cheap markets outside the US.

Source: Thomson Reuters, AMP Capital

In emerging countries, the average forward PE is quite low at around 10 times.

The next chart looks at price to earnings ratios calculated using a 10-year moving average of earnings, which is often referred to as the Shiller PE (after economist Robert Shiller) or the cyclically adjusted PE. On this measure US shares are clearly more expensive than since the tech boom. However, markets outside the US, including Europe and Australia, are not expensive at all. It should also be allowed that the 10-year moving average earnings calculation is distorted by the earnings slump a decade ago. As the 2008 and 2009 earnings slump starts to fall out of the calculation, the US Shiller PE will start to fall. But still there is better value elsewhere.

Source: Global Financial Data, AMP Capital

Finally, it’s worth looking at share market valuations that allow for the fact we are still in an environment of relatively low interest rates and bond yields. The next chart subtracts the 10-year bond yield for the US and Australia from their earnings yield (using forward earnings). This basically gives a sort of a proxy for the equity risk premium – the higher the better. While this gap is well down from its post GFC highs, it’s still reasonable, suggesting shares are still more attractive than bonds. Of course, this will change as bond yields drift higher, but as we have seen over the last two years since bond yields bottomed, this is likely to remain a relatively slow process.

Source: Thomson Reuters, AMP Capital

The overall impression is that measured against their own history developed country share markets are not dirt cheap, but they haven’t been for several years now and they are not at overvalued extremes. The main risk relates to the US share market, but other markets’ valuations are reasonable. So while the pull back in shares we have seen over the last few weeks could go further yet – as worries around the US interest rates, US/China trade, rising oil prices, problems in the emerging world, President Trump and the US mid-term elections and the Italian budget remain – at least most share markets are not trading at overvalued extremes which would potentially accentuate downside risks.

SOURCE: https://www.ampcapital.com/au/en/insights-hub/articles/2018/October/Are-shares-expensive

Boom turns to bust – falling Australian home prices. How far and for how long and what’s the impact on the economy?

October 19, 2018/0 Comments/in Archived /by Digilari

Key points

  • Property prices in Sydney and Melbourne are likely to see top to bottom falls of around 20% as credit conditions tighten, supply rises and a negative feedback loop from falling prices risks developing.
  • Other cities will perform better having not seen the boom of the last few years.
  • Property investors should remain wary of Sydney and Melbourne for now & focus on higher yielding markets.

Introduction

Australian capital city home prices have fallen for 12 months in a row and are down 4% from their peak. Most of the weakness relates to the previous boom time cities of Sydney and Melbourne but prices are continuing to fall in Perth and Darwin.

Source: CoreLogic, AMP Capital

This begs the questions: how far will prices drop? and what will it mean for the broader economy?

High prices and high debt – how did it come to this?

The big picture view on Australian property is:

  • Real house prices started to surge in the mid-1990s. This has led to them being expensive relative to income, rents, their long-term trend and by global standards. On our valuation measures prices are around 30% overvalued. The boom since the mid-1990s has rolled through different cities at different times, eg, starting in Sydney & Melbourne, then Perth, then Sydney & Melbourne again more recently.
  • As a result, affordability is poor and while interest rates may be low it’s become hard to save for a sufficient deposit.
  • The surge in home prices has gone hand in hand with a surge in household debt. See the next chart. This has taken the household debt to income ratio from the low end of OECD countries to the top end. The shift to overvaluation and high debt mostly occurred over the 1995-2005 period.

Source: OECD, RBA, AMP Capital

It’s popular to blame negative gearing, the capital gains tax discount and foreign buying for high home prices and debt. However, the basic drivers are a combination of the shift from high to low interest rates over the last 20-30 years boosting borrowing power, along with a surge in population growth from mid-last decade and the inadequacy of a supply response (thanks to tight development controls and lagging infrastructure) to suppress the resultant rise in the ratio of prices to incomes. Since 2006, annual population growth has averaged about 150,000 above what it was over the decade to the mid-2000s, which required roughly an extra 50,000 new homes per year, but dwelling completions have only recently caught up.

The tide has turned – expect more price falls

However, starting about a year ago it seems the tide has turned against property prices reflecting a range of factors:

  • Poor affordability – which has reduced the pool of buyers.
  • A tightening in bank lending standards under pressure from regulators – particularly around tougher income and expense verification and total debt to income limits for borrowers. The latter will particularly impact cities like Sydney and Melbourne which have high price to income ratios necessitating high debt to income ratios. It will also impact property investors with multiple properties (with around 1.5 million properties held by investors with multiple properties) with banks cracking down on lending to such investors. This is all making it harder to get housing loans.
  • A significant pool of interest only borrowers are scheduled to switch to principal and interest over the next few years resulting in a sharp rise in total debt servicing costs.
  • Banks withdrawing from lending to Self-Managed Super Funds – reducing the pool of property investors.
  • A cutback in foreign demand, partly due to Australian authorities making it more difficult. Chinese investment into Australian real estate has fallen by roughly 70% since 2015.
  • Rising unit supply – as the ongoing surge in unit construction completes and hits the market with Sydney and Melbourne most at risk. This risk is highlighted by Australia’s residential crane count of 528 cranes being way above the total crane count (ie residential and non-residential) in the US of 300 and Canada of 123!
  • Out of cycle bank mortgage rate increases may also be playing a role – although a minor one as the moves have been small, mortgage rates remain near record lows and some banks have cut rates for new borrowers.
  • Falling price growth expectations in response to falling prices risks resulting in a negative feedback loop for prices – as the FOMO (fear of missing out) phenomenon of up until a year ago risks turning into FONGO (fear of not getting out), particularly for investors as they realise they are only getting very low returns from net rental yields of around 1-2%.
  • Expectations that negative gearing and capital gains tax concessions will be made less favourable if there is a change of government are likely also impacting and have the potential to become a major drag on prices.

On their own some of these are not significant, but together they risk creating a perfect storm for the property market.

Home price outlook

For some time, we have been expecting top to bottom falls in Sydney and Melbourne prices of 15% spread out to 2020, implying price declines around 5% per annum. However, the risks are starting to skew to the downside – particularly around tighter credit and falling capital growth expectations made worse by fears of a change in tax arrangements. Auction clearances in recent weeks have been running around levels roughly consistent with 7-8% pa price declines. See next chart.

Source: Domain, AMP Capital

As such we are now allowing for a 20% decline in prices in these cities, again spread out to 2020, which would take average prices back to first half 2015 levels.

Source: CoreLogic, AMP Capital

By contrast home prices in Perth and Darwin are either at or close to the bottom having fallen back to levels seen more than a decade ago, and prices are likely to perform a lot better in Adelaide, Brisbane, Canberra and Hobart along with regional centres as they have not seen anything like the boom in Sydney and Melbourne. But they will see some impact from tighter credit. Overall, we now expect national average prices to fall nearly 10% out to 2020 which is a downgrade from our previous expectation for a 5% national average fall.

A crash is a risk but remains unlikely

With prices now falling naturally the calls for a property crash are getting a lot of airing. But these have been wheeled out endlessly over the last 15 years or so. Our assessment remains that a crash (say a 20% or more fall in national average prices) is unlikely unless we see much higher interest rates or unemployment (neither of which are expected) or a continuation of recent high construction for several years (which is unlikely as approvals are falling) and a collapse in immigration.

Strong population growth is continuing to drive strong underlying demand for housing. While mortgage stress is a risk, it tends to be overstated: there has been a sharp reduction in interest only loans already; debt servicing payments as a share of income have actually fallen slightly over the last decade; a significant number of households are ahead on their repayments; and banks’ non-performing loans remain low. Finally, while Sydney and Melbourne are at risk other cities have not seen the same boom and so are less vulnerable.

However, the risk of a crash cannot be ignored given the danger that banks may overreact and become too tight and that investors decide to exit in the face of falling returns, low yields and possible changes to negative gearing and capital gains tax.

The property cycle and the economy

The downturn in the housing cycle will affect the broader economy via slowing dwelling construction, negative wealth effects on consumer spending, less demand for household goods and via the banks as credit growth slows and if mortgage defaults rise. This will provide an offset to strong growth in infrastructure spending and solid growth in business investment and will constrain economic growth to around 2.5-3% which in turn will keep wages growth and inflation low. All of which is consistent with our view that the RBA won’t be raising rates until 2020 at the earliest and given the downside risks related to house prices it may have to cut rates. Housing weakness will also continue to constrain bank share returns.

Source: ABS, AMP Capital

Implications for investors

Over the very long-term, residential property adjusted for costs has similar returns to Australian shares. So, there is a role for it in investors’ portfolios. However, now remains a time for caution regarding housing as an investment destination – particularly in Sydney and Melbourne where it remains expensive, prices are likely to fall further & it offers very low rental yields. Best to look at other cities and regional areas that offer much better value.

The pullback in shares – seven things investors need to keep in mind

October 19, 2018/0 Comments/in Archived /by Digilari

Key points

  • The current pullback in shares has been triggered by a range of things – but most notably worries about rising US interest rates and the US/China conflict.
  • Shares may still have more downside, but we are of the view that it’s just another correction.
  • Key things for investors to bear in mind are that: corrections are normal; in the absence of recession, a deep bear market is unlikely; selling shares after a fall locks in a loss; share pullbacks provide opportunities for investors to buy them more cheaply; while shares may have fallen, dividends haven’t; and finally, to avoid getting thrown off a long-term investment strategy it’s best to turn down the noise during times like this.

Introduction

Every so often shares go through rough patches. We saw this most recently around February on the back of US inflation and interest rate concerns and the start of US tariffs which saw US shares and global shares fall roughly 10% and Australian shares fall 6%. Shares mostly recovered – even getting through the seasonally weak months of August and September surprisingly well – with US shares making new records and Australian shares hitting a ten-year high, but the worry list has returned again with US, global shares and Australian shares now down around 7% from their recent high. This note looks at the issues for investors and puts the falls into context.

What’s driving the latest plunge?

The recent plunge reflects a range of factors.

  • Investors have started to worry again that the very strong US economy will push the Fed into tightening a lot more and that this will cause a further sharp rise in bond yields which will threaten growth and share market valuations.
  • The trade conflict between the US and China is continuing to intensify and spilling over into other areas.
  • Technology shares, which have been key drivers of the US share markets rally (and outperformance) have been vulnerable – being somewhat overvalued and facing increased regulation in the US (which is something that President Trump has been threatening).
  • Rising oil prices due to strong global demand and threats to supply have added to concerns about inflation and growth.
  • Problems in the emerging world partly due to rising US interest rates poses a threat to global growth as reflected in a recent downgrade to the IMF’s global growth forecasts.
  • Nervousness remains in the US around President Trump and the Mueller inquiry and the upcoming US mid-term Congressional elections.
  • Tensions in the Eurozone regarding the Italian budget are weighing on European shares.
  • October is also known for share market volatility and this October is the 31st anniversary of the 1987 crash which often seems to create a bit of apprehension.

Because shares have fallen rapidly they are technically oversold and so could have a short-term bounce. But given that many of these issues could get worse before they get better the risk is that the pullback has further to go.

Considerations for investors

Sharp market falls with headlines screaming that billions of dollars have been wiped off the share market (funny that you never see the same headlines on the way up!) are stressful for investors as no one likes to see the value of their investments decline. However, several things are worth bearing in mind:
First, periodic corrections in share markets of the order of 5-15% are healthy and normal. For example, during the tech/dot. com boom from 1995 to early 2000, the US share market had seven pull backs greater than 5% ranging from 6% up to 19% with an average decline of 10%. During the same period, the Australian share market had eight pullbacks ranging from 5% to 16% with an average fall of 8%. All against a backdrop of strong returns every year. During the 2003 to 2007 bull market, the Australian share market had five 5% plus corrections ranging from 7% to 12%, again with strong positive returns every year. More recently, the Australian share market had a 10% pullback in 2012, an 11% fall in 2013 (the taper tantrum), an 8% fall in 2014, a 20% fall between April 2015 and February 2016 and a 7% fall earlier this year all in the context of a gradual rising trend. And it has been similar for global shares, but against a strongly rising trend. See the next chart. While they can be painful, share market corrections are healthy because they help limit a build-up in complacency and excessive risk taking.

Source: Bloomberg, AMP Capital

Related to this, shares climb a wall of worry over many years with numerous events dragging them down periodically, but with the long-term trend ultimately up & providing higher returns than other more stable assets. Bouts of volatility are the price we pay for the higher longer-term returns from shares.

Source: ASX, AMP Capital

Second, the main driver of whether we see a correction (a fall 5% to 15%) or even a mild bear market (with say a 20% decline that turns around relatively quickly like we saw in 2015-2016) as opposed to a major bear market (like that seen in the global financial crisis (GFC)) is whether we see a recession or not – notably in the US. The next table shows US share market falls greater than 10% since the 1970s. I know it’s a bit heavy – but I like this table! The first column shows the period of the fall, the second shows the decline in months, the third shows the percentage decline from top to bottom, the fourth shows whether the decline was associated with a recession or not, the fifth shows the gains in the share market one year after the low and the final column shows the decline in the calendar year associated with the share market fall. Falls associated with recessions are highlighted in red. Averages are shown for the whole period and for falls associated with recession at the bottom of the table.

Several points stand out. First, share market falls associated with recession tend to be longer and deeper. Second, falls associated with recessions are more likely to be associated with negative total returns (ie capital growth plus dividends) in the associated calendar year as a whole. Finally, as would be expected the share market rebound in the year after the low is much greater following falls associated with recession.

So whether a recession is imminent or not in the US is critically important in terms of whether we will see a major bear market or not. In fact, the same applies to Australian shares. Our assessment remains that US/global recession is not imminent:

  • Still high levels of business and consumer confidence globally are only just starting to help drive stronger consumer spending and business investment.
  • While US monetary conditions have tightened they are far from tight and they are still very easy globally and in Australia (with monetary tightening still a fair way off in Europe, Japan and Australia). We are a long way from the sort of monetary tightening that leads into recession.
  • Fiscal stimulus will boost US growth into next year, partly offsetting Fed rate hikes.
  • We have not seen the excesses – in terms of debt growth, overinvestment, capacity constraints and inflation – that normally precede recessions in the US, globally or Australia.

Reflecting this, global earnings growth is likely to remain reasonable providing underlying support for shares. So, for all these reasons its likely that the current pull back is more likely to be a correction rather than a major bear market.

Third, selling shares or switching to a more conservative investment strategy or superannuation option after a major fall just locks in a loss. With all the talk of billions being wiped off the share market, it may be tempting to sell. But this just turns a paper loss into a real loss with no hope of recovering.

Fourth, when shares and growth assets fall they are cheaper and offer higher long-term return prospects. So, the key is to look for opportunities the pullback provides. It’s impossible to time the bottom but one way to do it is to average in over time.

Fifth, while shares may have fallen, dividends from the market haven’t. So the income flow you are receiving from a well-diversified portfolio of shares remains attractive, particularly against bank deposits.

Source: RBA, Bloomberg, AMP Capital

Sixth, shares and other related assets often bottom at the point of maximum bearishness, ie just when you and everyone else feel most negative towards them. So the trick is to buck the crowd. “Be fearful when others are greedy. Be greedy when others are fearful,” as Warren Buffett has said.

Finally, turn down the noise. At times like this, negative news reaches fever pitch. Talk of billions wiped off share markets and warnings of disaster help sell copy and generate clicks and views. But such headlines are often just a distortion. We are never told of the billions that market rebounds and the rising long-term trend in share prices adds to the share market. Moreover, they provide no perspective and only add to the sense of panic. All of this makes it harder to stick to an appropriate long-term strategy let alone see the opportunities that are thrown up. So best to turn down the noise and chill out – yeah, I agree it’s sometimes easier said than done, but still!

SOURCE: https://www.ampcapital.com/au/en/insights-hub/articles/2018/October/the-pullback-in-shares-seven-things-investors-need-to-keep-in-mind

Successful investing despite 115 million worries and Truth Decay – how to turn down the noise

October 19, 2018/0 Comments/in Archived /by Digilari

Key points

  • A surge in financial information and opinion combined with our inclination to focus on negative news risks making us worse investors: more fearful, more jittery, more reactive, less reflective & more short term. This is potentially harmful to our long-term financial health.
  • Five ways to turn down the noise & stay focussed as an investor are: put the latest worries in context; recognise shares return more than cash in the long term because they can lose money in the short term; find a process to help filter noise; don’t check your investments so much; look for opportunities that worries throw up.

Information is not knowledge, knowledge is not wisdom – Frank Zappa (and maybe some others).

Introduction

It may seem that the worry list for investors is bigger and more confusing than ever before. Some of this may relate to US President Trump’s disruptive and “open mouth” approach as highlighted by the “trade war” and his frequent and sometimes contradictory tweets. For example, on 24th July Trump tweeted “Tariffs are the greatest!” But 12 hours later he tweeted “The European Union is coming to Washington tomorrow to negotiate a deal on Trade. I have an idea for them. Both the U.S. and the E.U. drop all Tariffs, Barriers and Subsidies!”
Now I think I know where he was coming from, but all this noise can create a lot of uncertainty for investors. But noise around Trump is part of a broader issue around information overload and broader again in terms of what a report by the RAND Corporation – a US non-partisan research organisation – has called Truth Decay. As we have observed in recent years there seems to be a never-ending worry list for investors that is receiving greater prominence as the information age enables the ready and rapid dissemination of news and opinion. But we need to recognise that much of this is just noise and ill-informed and that there is a big difference between information and wisdom when it comes to investing. The danger is that information and opinion overload is making us all worse investors as we lurch from one worry to the next resulting in ever shorter investment horizons in the process.

Just remember: What you’re seeing and what you’re reading is not what’s happening. – President Donald Trump

Truth Decay – what is it & what are its consequences?

Truth Decay as analysed by the RAND Corporation report is characterised by: disagreement about facts and their analytical interpretation; a blurring between fact and opinion; an increase in the volume and influence of opinion and personal experience over fact; and declining trust in traditional sources of facts such as government and newspapers. It’s evident in: declining support for getting children vaccinated despite medical evidence supporting it; perceptions crime has increased when it’s actually declined; and a lack of respect for scientific evidence around global warming. Elements of Truth Decay were evident in past periods like the 60s & 70s, but increasing disagreement about facts makes the current period different.

The causes of Truth Decay include: behavioural biases that leave people susceptible to information and opinion that confirms their views and aligns with their personal experience; the information revolution and social media that have led to a surge in the availability of information and opinion and the rise of partisan news channels; educational systems that have not taught us to be critical thinkers; social polarisation with rising inequality and division attracting people to opposing sides that are reinforced by participating in social media echo chambers. The consequences include a deterioration in civil debate as people simply can’t agree on the facts, political paralysis, disengagement from societies’ institutions and uncertainty.

Why is Truth Decay relevant for investors?

Truth Decay is relevant for investors because: it could lead to less favourable economic policy decisions which could weigh on investment returns; and investors are subject to the same forces driving Truth Decay such that it explains why the worry list for investors seems more worrying and distracting. The first is a topic for another day, but in terms of the heightened worry list facing investors there are three key drivers.

First, just as with the broader concept of Truth Decay various behavioural biases leave investors vulnerable in the way they process information. In particular, they can be biased to information and particularly opinions that confirm their own views. People are also known to suffer from a behavioural trait known as “loss aversion” in that a loss in financial wealth is felt much more distastefully than the beneficial impact of the same sized gain. This likely owes to evolution which has led to much more space in the human brain devoted to threat than reward. As a result, we are more predisposed to bad news stories that alert us to threat as opposed to good news stories. In other words bad news and doom and gloom find a more ready market than good news or balanced commentary as it appeals to our instinct to look for risks. Hence the old saying “bad new sells”.

Secondly, thanks to the information revolution we are now exposed to more information than ever on both how our investments are going and everything around them. This has particularly been the case since the GFC – the first iPhone was only released in 2007! In some ways this is great as we can check facts and analyse things very easily. But the downside is that we have no way of assessing all the extra information and less time to do so. So, it can become noise at best, distracting at worst. If we don’t have a process to filter it and focus on what matters we can simply suffer from information overload. This can be bad for investors as when faced with too much information we can become more uncertain, freeze up and make the wrong investment decisions as our natural “loss aversion” combines with what is called the “recency bias” that sees people give more weight to recent events which can see investors project bad news into the future and so sell after a fall.

But the explosion in digital/social media means we are bombarded with economic and financial news and opinions with 24/7 coverage by multiple web sites, subscription services, finance updates, TV channels, social media feeds, etc. And in competing for your attention, bad news and gloom trumps good news and balanced commentary as “bad news sells.” And the more entertaining it is the more attention it gets, which means less focus on balanced quality analysis. An outworking of all this is that the bad news seems “badder” and the worries more worrying. Google the words “the coming financial crisis” and you get 115 million search results with titles such as:

  • a vicious Fed-fuelled economic crisis is coming
  • coming financial crisis: a look behind the wizard’s curtain
  • here comes another global financial crisis
  • coming financial crisis will be much worse than Great Depression
  • another financial crisis is imminent, four reasons why
  • Japanese whales and the next financial crisis – I knew there was a connection!

In the pre-social media/pre-internet days it was much harder for ordinary investors to be exposed to such disaster stories on a regular basis. The obvious concern is that the combination of a massive ramp up in information and opinion combined with our natural inclination to zoom in on negative news is making us worse investors: more distracted, fearful, reactive and short-term focussed and less reflective and long-term focussed.

Five ways to manage information & opinion overload

To be a successful investor you need to make the most of the power of compound interest and to do that you need to invest for the long term and not get blown around by each new worry. And the only way to do that is to turn down the noise on the worry list. This is getting harder given the distractions on social media. But here are five suggestions as to how to do so:

First, put the latest worry in context. There is always an endless stream of worries. Here’s a list of the main worries of the last five years: Fed tapering; the US Government shutdown; Ukraine; IS terror threat; Ebola; deflation; Greece & Eurozone debt; China worries; Australian recession fears, property & banks; Brazil and Russia in recession; oil price collapse; manufacturing slump; Fed raising rates; falling profits; Brexit; Trump; North Korea; South China Sea tensions; Italy; and trade wars. Even fund managers go from one worry to another as evident in the next chart that tracks what they nominate as the biggest risk over time.

Source: BofA Merrill Lynch Global Fund Manager Survey, AMP Capital

Yet despite all the worries, investment returns have been good with, eg, average balanced superannuation funds returning 8.5% pa over the last five years. The global economy has had plenty of worries over the last century, but Australian shares still returned 11.8% pa since 1900 and US shares 9.8% pa.

Source: ASX, AMP Capital

Some of the worries we hear much about come to something big, but most of the time they don’t with US and Australian shares rising seven and eight years out of 10 respectively since 1900. So is the latest worry is any more threatening than the last one?

Second, recognise how markets work. Shares return more than cash in the long term because they can lose money in the short term. So, while the share market is highly volatile in the short term – often in response to loss-averse investors projecting recent bad news and worries into the future – it has strong returns over rolling 20-year periods. Short-term volatility is the price wise investors pay for higher long-term returns.

Third, find a way to filter news so that it doesn’t distort your investment decisions. For example, this could involve building your own investment process or choosing a few good investment subscription services and relying on them.

Fourth, don’t check your investments so much. On a day to day basis the Australian All Ords price index and the US S&P 500 price index are down almost as much as they are up. See the next chart. So, it’s a coin toss as to whether you will get good news or bad on a day to day basis. By contrast if you only look at how the share market has gone each month and allow for dividends the historical experience tells us you will only get bad news about 35% of the time. And if you stretch it out to each decade, since 1900 positive returns have been seen 100% of the time for Australian shares and 82% for US shares.

Data from 1995 and 1900. Source: Global Financial Data, AMP Capital

So, the less you look the less you will be disappointed and so the lower the chance that a bout of “loss aversion” will be triggered which leads you to sell at the wrong time.

Finally, look for opportunities that bad news and investor worries throw up. Periods of share market turbulence after bad news provide opportunities for smart investors as such periods push shares into cheap territory.

SOURCE: https://www.ampcapital.com/au/en/insights-hub/articles/2018/September/million-worries-and-truth-decay-how-to-turn-down-the-noise

Newsletter – 4th Oct 2018

October 4, 2018/0 Comments/in Archived, News /by Digilari

Dear Emma ,

There isn’t a lot to report from the office this month.  We have all been quite busy keeping Rod organised.  Monica is back to work after her recent surgery and is now busy reviewing some old policies and super funds.

For those clients with MLC investment accounts, some of the tax statements still have not been released but the estimated completion date is now showing as the 12th October 2018.  We have been keeping a close eye on the ones who have requested the statements so will email through as soon as we see them released.

Monica has another seminar coming up on Wednesday 24th October 2018 here in the office.  If you or anyone you know would benefit from attending this, please feel free to share the following link and register your attendance:

https://totalwealth.com.au/the-value-of-you

Until next month,

Emma

Lost in your career? The Japanese concept of Ikigai could help

September 21, 2018/0 Comments/in Archived /by Digilari

If you’ve lost your passion for work, Ikigai might help you re-discover it.

What’s the reason you get up in the morning? What’s your purpose in life? Where do your values, passions, beliefs and talents overlap?

These are big questions, which many of us struggle to have the answers to. But, could the Japanese concept of Ikigai be the answer to finding the answers? The practice of Ikigai is growing in popularity around the world as people use it to unearth and identify their purpose, and lead longer, more fulfilling personal and professional lives.

What is Ikigai?

“Ikigai refers to the things that give joy in your life,” says Ken Mogi, a Japanese neuroscientist and author of The Little Book of Ikigai.

“Ikigai is a spectrum, from small joys to life’s big goals. Ikigai can be a private joy, as well as something socially valuable. Quite often, Ikigai is the reason you get up in the morning.”

Some of the world’s longest-living citizens reside in Japan and it’s thought that Ikigai contributes to longevity1, not only in Japan, but around the globe (whether they have a word for it or not).

There are four principles of Ikigai:

  • What you love (passion and mission).
  • What the world needs (mission and vocation).
  • What you are good at (passion and profession).
  • What you can get paid for (profession and vocation).

If you picture a Venn diagram with these four principles, the place where the four circles overlap is your Ikigai.

“Ikigai gives your life a purpose, while giving you the grit to carry on,” says Mogi.

Why Ikigai resonates with so many

Mogi believes that Ikigai is an antidote for the stresses and psychological pressures of living in a fast-paced world.

“Under the globalising economy, people are increasingly feeling pressured to do better with their lives,” he says. “But success does not come to everyone.”

The principles behind Ikigai recognise that private joys in your life might not necessarily have social significance or translate into your professional life.

“When you have Ikigai, you are likely to perform better, realising flow and mindfulness,” says Mogi.

“And as a result, you might have social success, but that’s a bonus. Even if you do not succeed [at work], you would have Ikigai all the same.”

Ikigai is an antidote for the stresses and psychological pressures of living in a fast-paced world.

Finding your Ikigai

Ikigai isn’t about recognition or acclaim, but rather, it’s about starting small and following the things that give you pleasure.

According to Mogi, there are five pillars of activity that allow Ikigai to flourish:

  1. Starting small (focusing on the details).
  2. Releasing yourself (accepting your strengths and flaws).
  3. Finding harmony and sustainability (connecting with others).
  4. Recognising the joy of little things (appreciating your taste, touch, smell, sight and hearing).
  5. Being in the here and now (being mindful of what you’re experiencing).

Mogi says these five pillars underpin the essence of Ikigai and can be applied to any of the four principles (what you love, what you can get paid for, what the world needs or what you’re good at).

“If you apply the five pillars of activity to the intersection, you would get the most Ikigai,” says Mogi.

Applying Ikigai to your career

The work of childhood is play, and Mogi believes that if someone has lost their passion for work, the best place to start is by reflecting on childhood or a time when life seemed simpler.

“Ikigai is like reviving the inner child,” he says. “What were the things that gave you joy? What did you enjoy doing, without any consideration of social relevance or contributions to your eventual success?”

Children are naturally drawn to the activities and the people that give them pleasure with little regard for how they are perceived or the end product.

“Going back to the intuitions of the inner child would give the necessary rehabilitation, and re-boost your passion to live fully,” says Mogi.

You can define and pursue your own Ikigai, without needing endorsement or authority from others. But, Mogi says, discussing your Ikigai with family and friends can help to realise the rich diversity of Ikigai among people.

“Starting really small usually does the trick,” he says. “If you follow your Ikigai intuitions wholeheartedly, small projects often lead to big things.”

SOURCE: https://www3.colonialfirststate.com.au/personal/guidance/lifestyle/lost-in-your-career-the-japanese-concept-of-ikigai-could-help.html

Five charts to keep an eye on regarding the global economy

September 20, 2018/0 Comments/in Archived /by Digilari

Key points

  • Whether a recession is imminent or not in the US, and more broadly globally, is critically important in terms of whether a major bear market in shares is on the way.
  • Five key global charts to watch in getting a handle on whether a major downturn is on the way are: global business conditions PMIs; global inflation; the US yield curve; the US dollar; and global trade growth.
  • While risks have increased – particularly in the US where the economic cycle is more advanced and around the $US and emerging countries and global trade – our assessment remains that a major US/global downturn still remains a way off.
  • Which supports our assessment that notwithstanding periodic corrections – including through the seasonally weak period for share markets that we are now in – the broad trend in share markets is likely to remain up.

Introduction

There is lots of talk about when the next major economic downturn will be. This interest seems to have been particularly noticeable over the last week or so given the ten-year anniversary of the failure of Lehman Brothers which helped usher in the worst phase of the Global Financial Crisis (GFC), which naturally prompted the question of when the next one will be. But it’s also been given impetus as the current US bull market and economic expansion are approaching record territory in terms of duration and given the threats from a US-driven trade war.

The historical experience indicates that share market downturns are much deeper and longer when there is a recession, particularly in the US economy. So, whether a recession is imminent or not in the US, and more broadly globally, is critically important in terms of whether a major bear market is on the way. Of course, no one really knows for sure (despite many claiming they do!). But certain indicators help provide some guidance as to the risks. This note looks at five charts to monitor in terms of the state of the global economy.

Chart #1 – Global business conditions PMI

Global Purchasing Managers Indexes (PMIs), which are surveys of purchasing managers at businesses in most major countries, provide an excellent and timely guide to the state of the global economy. As can be seen in the next chart, while they are down from their peaks of earlier this year they remain very strong indicating that global growth remains strong. This is particularly the case in the US. Quite clearly a sharp downturn, as occurred going into the GFC, would be a concern for global growth but so far so good.

Source: Bloomberg, AMP Capital

Chart 2 – Global inflation

Most major economic downturns are preceded by a rise in inflation to above central bank targets resulting in aggressive monetary tightening. The period prior to the GFC was something of an exception in terms of core inflation, ie inflation excluding food and energy. But average headline inflation rose to around 4% across the US, the Eurozone and Japan at the time as energy prices surged and the run up to the GFC was associated with tight monetary policy in the US and Europe (where the focus at the time was on headline inflation).

Source: Bloomberg, AMP Capital

At present, core inflation in major global economies is benign. In the US core inflation is around 2%, which is the Fed’s target and headline inflation is falling. Inflation in China is also around 2%, which is below the Government’s 3% target/forecast. And inflation in the Eurozone and Japan, whether headline or core, is below both the European Central Bank’s and the Bank of Japan’s 2% targets. While a lack of spare capacity in the US means that the Fed will continue raising interest rates to more normal levels, with inflation around target (and other signs of inflation pressure like wages growth rising only slowly) it can continue to be gradual in doing so. Meanwhile, with inflation below target in in Europe, Japan and China, monetary tightening by their central banks is a long way off. Obviously, a clearer upswing in core inflation would be a warning sign of more aggressive monetary tightening being on the way, which would then threaten economic growth.

Chart 3 – The US yield curve

The yield curve is a good guide to the stance of monetary policy. When short-term interest rates are low relative to long-term rates businesses can borrow short and lend (or invest) long and this grows the economy. But it’s not so good when short rates are above long rates – or the curve is inverted. And an inverted US yield curve has preceded US recessions. So, when it’s heading in this direction some start to worry. As a result, it’s worth keeping an eye on and it’s our third chart. But there are several complications to allow for.

First, there are several versions of the yield curve. The traditional yield curve based on the gap between 10-year bond yields and the Fed Funds rate has flattened but only to 1.2%. Moreover, a shorter yield curve based on the gap between 2-year bond yields and the Fed Funds rate predicted past recessions like the longer yield curve but has actually been steepening lately which is positive. So our chart includes both yield curves. Both are yet to go negative as occurred prior to the last three US recessions.

Source: NBER, Bloomberg, AMP Capital

But there are several other things to allow for. The yield curve can give false signals (circled on the chart) and the lags from an inverted curve to a recession can be around 15 months.

Various factors may be flattening the traditional yield curve unrelated to economic growth expectations including low German and Japanese bond yields holding down US yields and higher levels of investor demand for bonds post the GFC as they have proven to be a good diversifier to shares in times of crisis.

On top of all this, a flattening yield curve caused by rising short-term rates and falling long term-rates is more negative than a flattening when both short and long-term rates go up like recently.

So all up the yield curve is worth keeping an eye on but both its long term and short term versions really need to go negative before getting too concerned. So far so good. Of course, it’s worth keeping an eye on other measures of US monetary tightness as well – for example past US recessions have been preceded by the Fed Funds rates being well above inflation and nominal economic growth whereas it’s still a long way from either now.

Chart 4 – The US dollar

Moves in most currencies are usually only really of relevance for the country that the currency belongs to. The US dollar is a clear exception to this mainly because debt is often denominated in US dollars. In particular, emerging countries tend to have a lot of US dollar denominated debt so when the $US falls in value versus their own currency, servicing that debt gets cheaper but when the $US goes up in value, servicing that debt gets more expensive.

Source: Bloomberg, AMP Capital

This has been the case lately with the rising US dollar against most currencies including emerging market currencies as shown in our fourth chart, adding to problems in various emerging countries. Further strong gains in the US dollar as the Fed continues to hike risks worsening emerging market problems and the risks that this poses to global growth (as the emerging world is around 60% of global GDP). By contrast if the US dollar moderates, the pressure on emerging countries is likely to recede.

Chart 5 – World trade growth

In recent times there has been much debate as to whether the era of globalisation is coming to an end resulting in a peak in world trade. This could be for somewhat benign reasons as services become an ever-greater share of economic activity and manufacturing becomes less labour dependent. But it could also be due to rising protectionism with US policies under Trump a big threat. It’s early days so far with only about 12% of US imports being subject to increased tariffs for an average tariff increase across all US imports of just 1.6% (after the latest tranche is implemented). This is a long way from 1930 that saw all US imports subject to a 20% tariff hike and other countries do the same. While we still see a negotiated solution, it may not come till after the US mid-term elections. Global trade growth has picked up over the last two years but its recently started to slow a bit. It’s too early for this year’s trade conflict to show up in trade data but it’s worth watching this chart as slower global trade growth would pose a threat to global economic growth.

Source: CPB World Trade Volume Index, AMP Capital

Concluding comments

On balance these indicators suggest the outlook remains okay. Perhaps the greatest near-term risks are around the US dollar and Trump’s trade war. Beyond this, cyclical indications are still okay. And while we haven’t had room to fit it in here the signs of cyclical excess that normally precede major economic downturns – eg, very strong wages growth and a high level of cyclical spending (consumer durables, housing and investment) as a share of GDP – aren’t particularly evident in the US and are a long way from being evident in other major countries.

SOURCE: https://www.ampcapital.com/au/en/insights-hub/articles/2018/September/five-charts-to-keep-an-eye-on-regarding-global-economy

Page 8 of 13«‹678910›»

Like to know more…

Enter your details and we will contact you with in 24 hours

    Want to learn more?

    Come in for a chat!

    Get in touch for your FREE no-obligation consultation. Appointments available during business hours or after hours by appointment.

    Get In Touch

    Financial Advice Services

    Pre-retirement and Retirement Planning

    Centrelink Maximisation Strategies

    Superannuation Fund and Strategy Advice

    Self Managed Superannuation Funds

    Personal Risk Insurance

    Wealth Accumulation

    Tax Minimisation and Tax Planning

    Debt Management

    Lifestyle Expense Planning

    Estate Planning

    Useful Links

    Meet the Team

    Our Advice process

    Fees & Charges

    Blogs

    Financial Calculators

    Financial Services Guide

    Privacy Policy

    Terms & Conditions

    General Advice Warning

    Opening Hours

    Appointments available outside these times by prior arrangement.

    Monday 9am - 5pm
    Tuesday 9am - 5pm
    Wednesday 9am - 5pm
    Thursday 9am - 5pm
    Friday 9am - 4pm
    Saturday Closed
    Sunday Closed

    Our Office

    11 Lawrence St, North Ipswich QLD 4305

    Contact Us

    Phone: (07) 3281 1226
    Email: twm@totalwealth.com.au
    Fax: (07) 3282 9900

    Postal address

    PO Box 2648, North Ipswich QLD 4305

    Enquire online

    LFG Financial Services
    Total Wealth Management is an authorised representative of LFG Financial Services
    © Copyright Total Wealth Management Pty Ltd ALL RIGHTS RESERVED. | Design by SG to 'By Digilari'
    • Financial Services Guide
    • Complaints Policy
    • Privacy Policy
    • Terms & Conditions
    • General Advice Warning
    Scroll to top