Five charts to watch regarding the global economy and markets this year
Key points
- Shares are at risk of a short-term correction or consolidation after a strong run over the last year and with sentiment now very bullish. However, this year should still see good returns for investors as global growth edges up and interest rates remain low.
- Five key global charts to watch are: global business conditions PMIs; global inflation; the US yield curve; the US dollar; and global trade growth.
- So far so good, with PMIs improving a bit, inflation remaining low, the yield curve steepening, the $US showing signs of topping and the US/China trade truce auguring well for some pick up in world trade growth.
Introduction
Our high-level investment view for this year is that a combination of improving global growth boosting profits and still easy monetary conditions will help drive reasonable investment returns, albeit more modest than the very strong gains of 2019. This note revisits five charts we see as critical to the outlook.
Chart #1 – Global business conditions PMIs
Global Purchasing Managers Indexes (PMIs) – surveys of purchasing managers at businesses in most major countries – are an excellent and timely guide to the state of the global economy. Although services sector PMIs held up better than for manufacturers – which tend to be more cyclical – both softened through 2018 and into mid-2019. Since then they have shown signs of improvement suggesting that the global monetary easing seen through 2019 with interest rate cuts and renewed quantitative easing is working. Going forward they will need to improve further to be consistent with our view that growth will pick up this year.
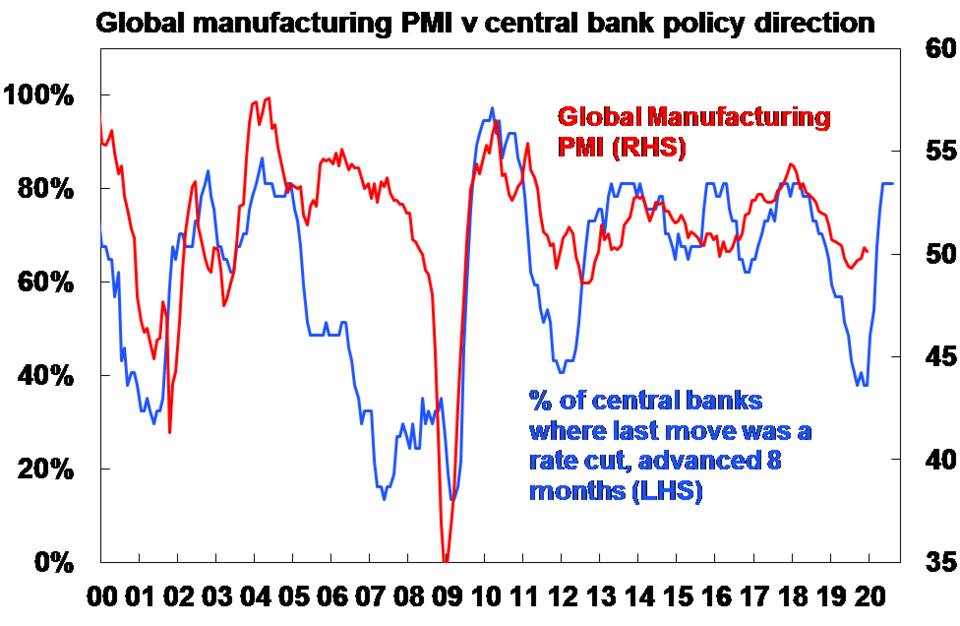

But so far, the 2018-19 slowdown in business conditions PMIs (and hence global growth) looks like the slowdowns around 2012 and 2015-16 as opposed to the recession associated with the global financial crisis (GFC).
Chart 2 – Global inflation
Major economic downturns are invariably preceded by a rise in inflation to above central bank targets causing central banks to slam the brakes on. At present, core inflation – ie inflation excluding the volatile items of food and energy – in major global economies remains benign. In the US, the Eurozone and Japan core inflation is well below their central bank targets of 2%. Inflation in China spiked to 4.5% through last year, but core inflation has been falling to 1.4% and is well below the Government’s 3% target/forecast. A clear upswing in core inflation would be a warning sign that spare capacity has been used up, that monetary easing has gone too far, and that the next move will be aggressive monetary tightening. But at present, we are a long way from that.
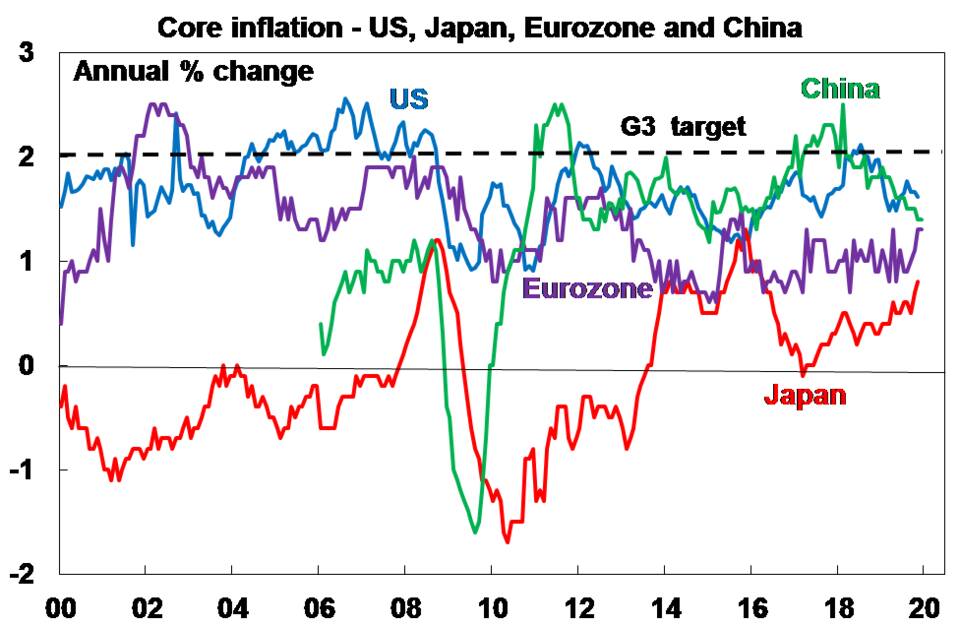

Chart 3 – The US yield curve
The yield curve is a guide to the stance of monetary policy. When short-term interest rates are low relative to long-term rates businesses can borrow short and lend (or invest) long and this grows the economy. But it’s not so good when short rates are above long rates. An inverted US yield curve has preceded past US recessions. So, when this happened last year there was much concern that a US recession was on the way.
However, in recent months various versions of the yield curve – with the gap between the US 10 year bond yield and the Fed Funds rate and the US 10 year bond yield and the 2 year bond yield shown in the next chart – have uninverted as the Fed cut rates and hence short-term yields fell, good economic data provided confidence that recession will be avoided and the US/China trade war de-escalated reducing the threat posed by the trade war.

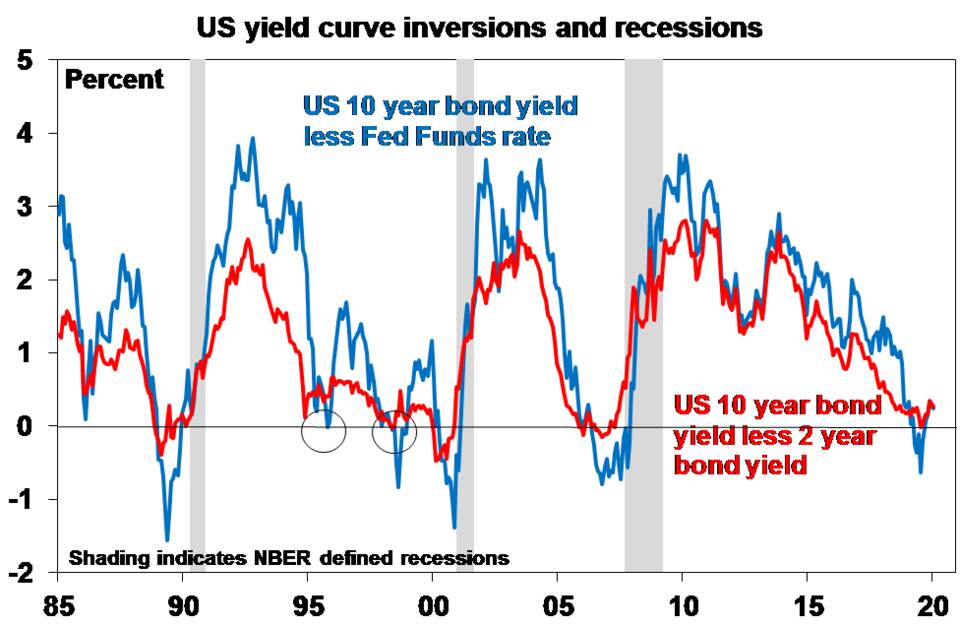
While the US yield curve has uninverted in the past and yet a recession has still come along, the uninversion seen in recent months coming after such a shallow and short-lived inversion provides confidence that the inversion seen last year gave a false signal as occurred in the mid to late 1990s (as circled).
In addition, it’s also worth noting that other indicators suggest that US monetary policy was far from tight – the real Fed Fund rate was barely positive, and the nominal Fed Funds rate was well below nominal GDP growth and both are far from levels that in the past have preceded US recessions.
So it’s a good sign that the US yield curve has been steepening in recent months. A return to yield curve inversion – which became deeper than seen last year – would be a concern of course.
Chart 4 – The US dollar
Moves in the value of the US dollar against a range of currencies are of broad global significance. This is for two reasons. First, because of the relatively low exposure of the US economy to cyclical sectors like manufacturing and materials the $US tends to be a “risk-off” currency, ie it goes up when there are worries about global growth. Second, because of its reserve currency status and that a lot of global debt is denominated in US dollars particularly in emerging countries, when the $US goes up it makes it tough for emerging countries.
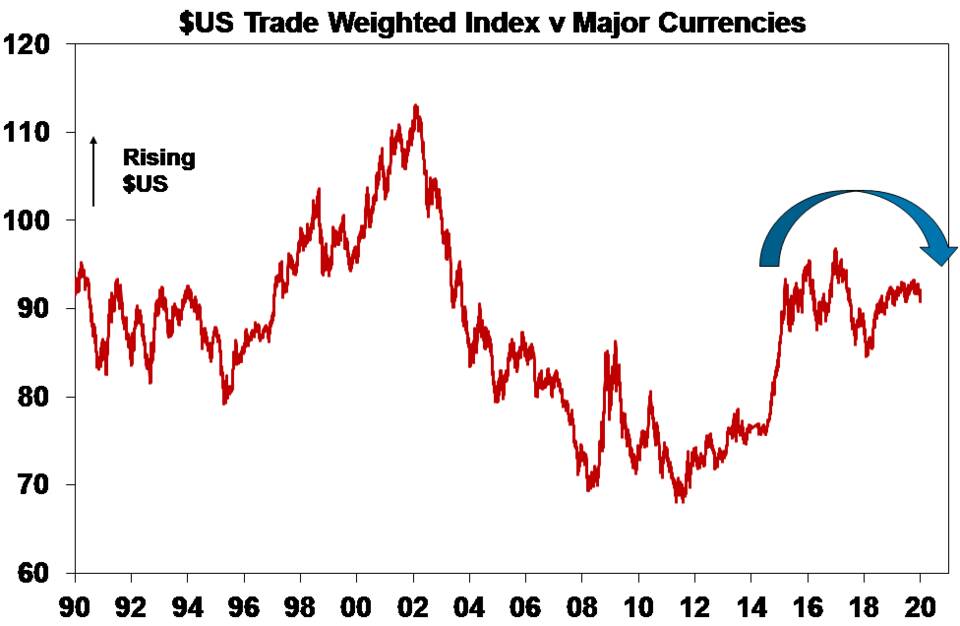

So when global uncertainty is rising this pushes the $US up which in turn makes it hard for emerging countries with $US denominated debt. If we are right though and global growth picks up a bit, trade war risk remains in abeyance and the Iran conflict does not become big enough to derail things then the $US is likely to decline further which would be positive for emerging countries.
Chart 5 – World trade growth
It’s reasonable to expect growth in world trade to slow over time as services become an ever-greater share of economic activity and manufacturing becomes less labour dependent. However, President Trump’s trade wars since 2018 combined with slower global growth saw global trade fall last year. This year should see some reversal if the trade wars remain in abeyance as Trump focuses on keeping the US economy strong to aid his re-election and global growth picks up a bit.


US recession still a way away
In recent years there has been much debate about whether a new major bear market in shares is approaching. Such concerns usually reach fever pitch after share markets have already fallen 20% or so (as they did into 2011, 2016 and 2018). The historical experience tells us that what happens in the US is critical to how deep share market falls get. Deep (“grizzly”) bear markets like the 50% plus fall seen in the GFC are invariably associated with US recession. So, whether a recession is imminent in the US, and more broadly globally, is critically important in terms of whether a major bear market is on the way. The next table summarises the key indicators we are still watching in this regard.

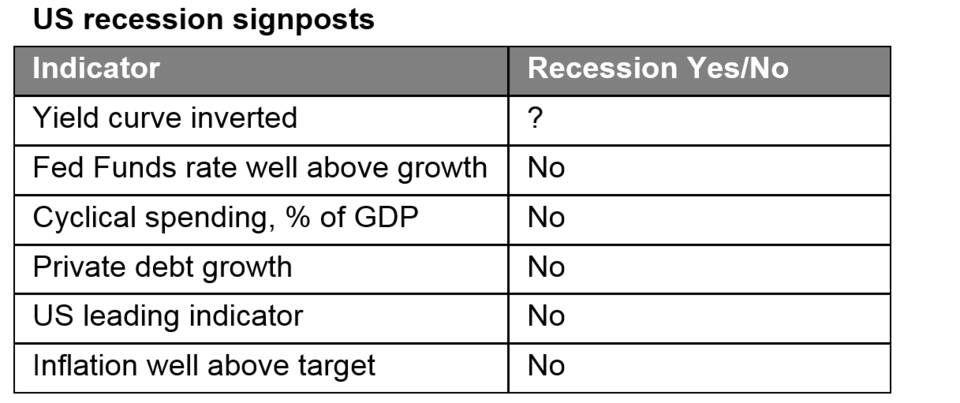
These indicators are still not foreshadowing an imminent recession in the US. The yield curve is most at risk if it inverts again. But other measures of monetary policy in the US are not tight and we have not seen the sort of excesses that normally precede recessions – discretionary or cyclical spending as a share of GDP is low, private debt growth has not been excessive, the US leading indicator is far from recessionary levels and inflation is benign.
Concluding comments
At present, most of these charts or indicators are moving in the right direction, with the PMIs improving a bit, inflation remaining low, the yield curve steepening, the $US showing signs of topping and the US/China trade truce auguring well for some pick up in world trade growth. But to be consistent with our view that this year will see good returns from shares we need to see further improvement and so these charts are worth keeping an eye on.


Leave a Reply
Want to join the discussion?Feel free to contribute!